GreenKube
Prometheus & Grafana Integration
Dashboard preview
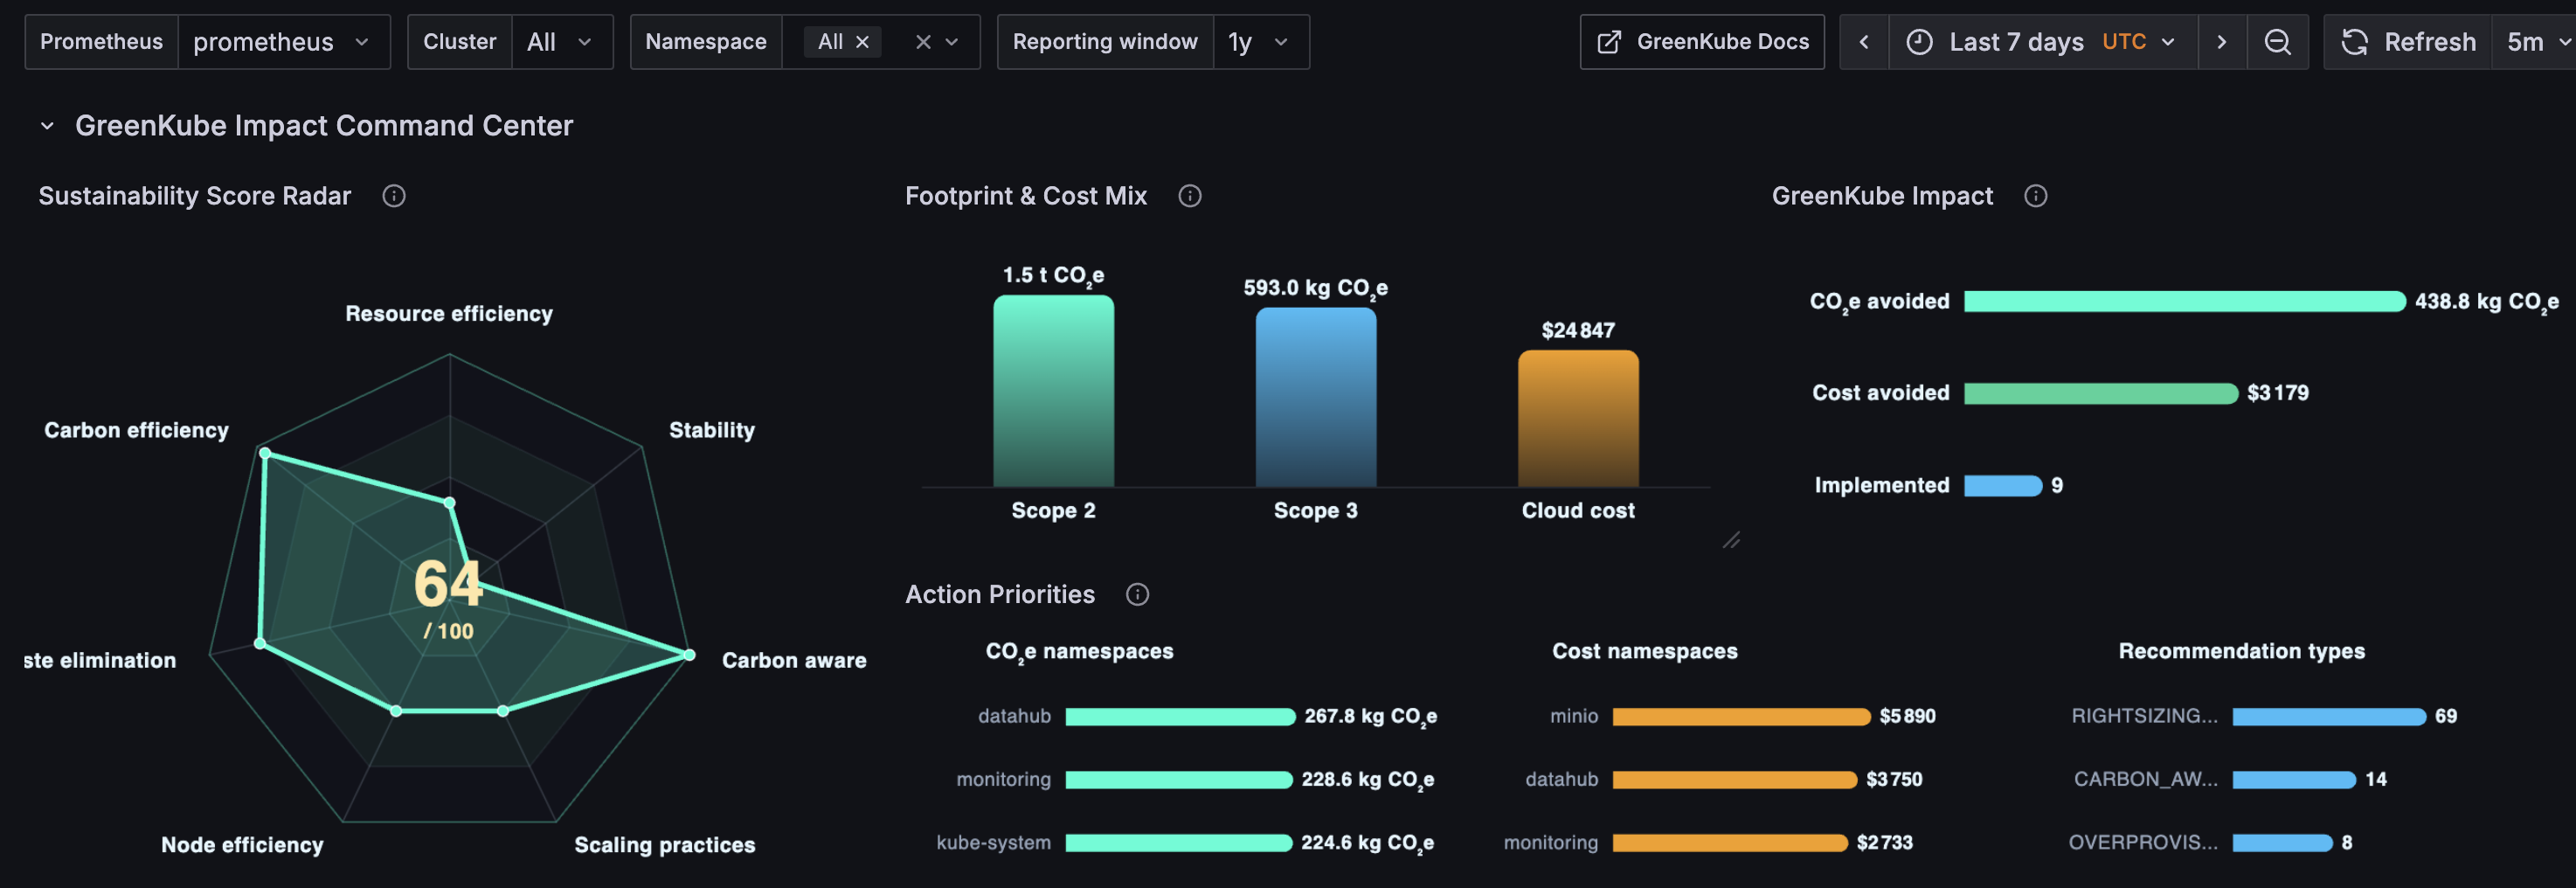
GreenKube has two distinct Prometheus integrations that serve different purposes.
How they relate
| Direction | What it does | Required? |
|---|---|---|
| GreenKube → Prometheus | GreenKube queries your cluster’s Prometheus for CPU, memory, network, and disk metrics | Strongly recommended |
| Prometheus → GreenKube | Prometheus scrapes GreenKube’s /prometheus/metrics endpoint to expose CO₂e, cost, and sustainability metrics in Grafana |
Optional |
1. Scraping GreenKube metrics into Prometheus
With the Prometheus Operator (kube-prometheus-stack)
Enable the ServiceMonitor in values.yaml:
monitoring:
  serviceMonitor:
    enabled: true           # Creates a ServiceMonitor CRD resource
    namespace: monitoring   # Namespace where Prometheus looks for ServiceMonitors
    interval: 30s           # Scrape interval (30s recommended)
  networkPolicy:
    enabled: true           # Opens the Prometheus → greenkube-api network path
    prometheusNamespace: monitoring
Or via --set:
helm upgrade greenkube greenkube/greenkube \
  -n greenkube \
  --set monitoring.serviceMonitor.enabled=true \
  --set monitoring.networkPolicy.enabled=true
The ServiceMonitor scrapes the http port (8000) at /prometheus/metrics every 30 seconds.
It also restores custom metric labels (cluster, region, zone, namespace) that
Prometheus would otherwise overwrite with the scrape-target labels.
Without the Prometheus Operator
Add a static scrape job to prometheus.yml:
scrape_configs:
  - job_name: greenkube
    scrape_interval: 30s
    metrics_path: /prometheus/metrics
    static_configs:
      - targets:
          - greenkube-api.greenkube.svc.cluster.local:8000
2. Cluster name auto-detection
GreenKube reads K8S_NODE_NAME (injected via the Kubernetes Downward API) and resolves the
cluster name in this order:
CLUSTER_NAMEenv var (if explicitly set)K8S_NODE_NAME→ query node labels for EKS / GKE / AKS provider-specific cluster tagK8S_NODE_NAMEitself (works on minikube and bare-metal)"default"(final fallback)
All emitted metrics carry a cluster label set to this resolved name.
3. Available Prometheus metrics
Every metric is a Prometheus Gauge (point-in-time snapshot, refreshed on each scrape).
Cluster-wide metrics
| Metric | Labels | Description |
|---|---|---|
greenkube_sustainability_score |
cluster, namespace |
Composite sustainability score (0–100) — emitted per namespace and with namespace="__all__" for the cluster aggregate |
greenkube_cluster_co2e_grams_total |
cluster |
Total operational CO₂e emissions (g) |
greenkube_cluster_embodied_co2e_grams_total |
cluster |
Total embodied (Scope 3) CO₂e (g) |
greenkube_cluster_cost_dollars_total |
cluster |
Estimated total cloud cost ($) |
greenkube_cluster_energy_joules_total |
cluster |
Total energy consumed (J) |
greenkube_cluster_pod_count |
cluster |
Number of running pods |
greenkube_cluster_namespace_count |
cluster |
Number of active namespaces |
greenkube_cluster_co2e_saved_grams_total |
cluster |
Annual projected CO₂e savings from applied recommendations (g) — legacy, prefer greenkube_dashboard_savings_co2e_grams_total |
greenkube_cluster_cost_saved_dollars_total |
cluster |
Annual projected cost savings from applied recommendations ($) — legacy, prefer greenkube_dashboard_savings_cost_dollars_total |
greenkube_carbon_intensity_zone |
cluster, zone |
Current grid carbon intensity per electricity zone (gCO₂/kWh) |
greenkube_carbon_intensity_score |
cluster |
Energy-weighted average grid carbon intensity across the cluster (gCO₂/kWh) |
greenkube_sustainability_dimension_score |
cluster, namespace, dimension |
Score per sustainability dimension — emitted per namespace and with namespace="__all__" for the cluster aggregate |
greenkube_estimated_metrics_ratio |
cluster, namespace |
Fraction of metrics that are estimated (0 = all measured) — emitted per namespace and with namespace="__all__" |
greenkube_metrics_total |
cluster |
Total number of combined metric records in the latest window |
greenkube_last_collection_timestamp_seconds |
cluster |
Unix timestamp of the most recent metric in the database |
Namespace-level metrics
| Metric | Labels | Description |
|---|---|---|
greenkube_namespace_co2e_grams_total |
cluster, namespace |
Operational CO₂e per namespace (g) |
greenkube_namespace_embodied_co2e_grams_total |
cluster, namespace |
Embodied CO₂e per namespace (g) |
greenkube_namespace_cost_dollars_total |
cluster, namespace |
Cloud cost per namespace ($) |
greenkube_namespace_energy_joules_total |
cluster, namespace |
Energy per namespace (J) |
greenkube_namespace_pod_count |
cluster, namespace |
Pod count per namespace |
greenkube_namespace_recommendation_savings_co2e_grams_total |
cluster, namespace |
Projected annual CO₂e savings for namespace (g) |
greenkube_namespace_recommendation_savings_cost_dollars_total |
cluster, namespace |
Projected annual cost savings for namespace ($) |
Pod-level metrics
All pod-level metrics share labels cluster, namespace, pod, node, region.
| Metric | Description |
|---|---|
greenkube_pod_co2e_grams |
CO₂e per pod (g) |
greenkube_pod_embodied_co2e_grams |
Embodied CO₂e per pod (g) |
greenkube_pod_cost_dollars |
Cost per pod ($) |
greenkube_pod_energy_joules |
Energy per pod (J) |
greenkube_pod_cpu_usage_millicores |
CPU usage (millicores) |
greenkube_pod_cpu_request_millicores |
CPU request (millicores) |
greenkube_pod_cpu_efficiency_ratio |
CPU efficiency (usage ÷ request) |
greenkube_pod_memory_usage_bytes |
Memory usage (bytes) |
greenkube_pod_memory_request_bytes |
Memory request (bytes) |
greenkube_pod_memory_efficiency_ratio |
Memory efficiency (usage ÷ request) |
greenkube_pod_network_receive_bytes |
Network RX (bytes) |
greenkube_pod_network_transmit_bytes |
Network TX (bytes) |
greenkube_pod_disk_read_bytes |
Disk read (bytes) |
greenkube_pod_disk_write_bytes |
Disk write (bytes) |
greenkube_pod_restart_count |
Pod restart count |
greenkube_pue |
Power Usage Effectiveness (per pod measurement) |
greenkube_grid_intensity_gco2_kwh |
Grid carbon intensity (gCO₂/kWh, per pod measurement) |
Node metrics
All node metrics share labels node, instance_type, zone, region, cloud_provider, architecture.
| Metric | Description |
|---|---|
greenkube_node_info |
Node metadata gauge (always 1) |
greenkube_node_cpu_capacity_millicores |
Node total CPU capacity (millicores) |
greenkube_node_cpu_allocated_millicores |
CPU allocated to pods (millicores) |
greenkube_node_memory_capacity_bytes |
Node total memory capacity (bytes) |
greenkube_node_memory_allocated_bytes |
Memory allocated to pods (bytes) |
greenkube_node_embodied_emissions_kg |
Node embodied CO₂e (kg) |
greenkube_zone_grid_intensity_gco2_kwh |
Zone-level grid carbon intensity (cluster, zone, lookup, nodes, node_count, bubble_size, bubble_label, map_label) — carries enriched labels used by the Geomap panel |
Recommendations & savings metrics
| Metric | Labels | Description |
|---|---|---|
greenkube_recommendations_total |
cluster, namespace, type, priority |
Count of active open recommendations — emitted per namespace and with namespace="__all__" for the cluster-wide aggregate |
greenkube_recommendations_implemented_total |
cluster, namespace, type |
Count of implemented recommendations — emitted per namespace and with namespace="__all__" |
greenkube_recommendations_savings_co2e_grams |
cluster, type |
Projected annual CO₂e savings per recommendation type (g) |
greenkube_recommendations_savings_cost_dollars |
cluster, type |
Projected annual cost savings per recommendation type ($) |
greenkube_top_recommendations |
cluster, rank, sort_metric, value_metric, namespace, type, resource, scope, priority |
Ranked active recommendations. sort_metric is co2 or cost; value_metric is co2e_grams or cost_dollars so Grafana can display both projected annual savings values for each ranked action |
greenkube_co2e_savings_attributed_grams_total |
cluster, recommendation_type |
Cumulative CO₂e savings since installation (g) — prefer greenkube_dashboard_savings_co2e_grams_total for windowed queries |
greenkube_cost_savings_attributed_dollars_total |
cluster, recommendation_type |
Cumulative cost savings since installation ($) — prefer greenkube_dashboard_savings_cost_dollars_total for windowed queries |
Pre-computed dashboard summary metrics
These gauges are refreshed on every Prometheus scrape and serve the $dashboard_window variable in Grafana. The window label matches one of 1h, 6h, 24h, 7d, 30d, ytd, 1y (and their second aliases such as 3600s). The namespace label is either a real namespace, __all__ (cluster aggregate), or _cluster (cluster-scoped savings with no namespace).
| Metric | Labels | Description |
|---|---|---|
greenkube_dashboard_summary_co2e_grams_total |
cluster, window, namespace, scope |
Pre-computed CO₂e totals for a fixed time window. scope is one of scope2, scope3, all |
greenkube_dashboard_summary_cost_dollars_total |
cluster, window, namespace |
Pre-computed cloud cost total for a fixed time window |
greenkube_dashboard_summary_energy_joules_total |
cluster, window, namespace |
Pre-computed energy total for a fixed time window |
greenkube_dashboard_summary_pod_count |
cluster, window, namespace |
Pre-computed pod count for a fixed time window |
greenkube_dashboard_summary_namespace_count |
cluster, window, namespace |
Pre-computed namespace count for a fixed time window |
greenkube_dashboard_savings_co2e_grams_total |
cluster, window, namespace, recommendation_type |
DB-backed CO₂e savings attributed during a fixed dashboard time window |
greenkube_dashboard_savings_cost_dollars_total |
cluster, window, namespace, recommendation_type |
DB-backed cost savings attributed during a fixed dashboard time window |
Dashboard window metrics vs. cumulative totals
Use
greenkube_dashboard_savings_co2e_grams_total/greenkube_dashboard_savings_cost_dollars_totalto display exact savings for the selected$dashboard_window. These values are pre-computed from the DB on each scrape — noincrease()wrapper needed.
greenkube_co2e_savings_attributed_grams_totalandgreenkube_cost_savings_attributed_dollars_totalare cumulative totals since installation and are kept for backward compatibility.The
greenkube_cluster_co2e_saved_grams_total/greenkube_cluster_cost_saved_dollars_totalcluster metrics are annual projections only.
4. Grafana dashboard
A pre-built dashboard is available at dashboards/greenkube-grafana.json.
Import
⚠️ Always use
/api/dashboards/import(not/api/dashboards/db). Only the import endpoint resolves the${DS_PROMETHEUS}variable; usingdbleaves all panels with “datasource is not set”.
Via UI: Dashboards → Import → Upload JSON file → select your Prometheus datasource.
Via script:
import json, urllib.request, base64

with open("dashboards/greenkube-grafana.json") as f:
    dashboard = json.load(f)

payload = json.dumps({
    "dashboard": dashboard,
    "folderId": 0,
    "overwrite": True,
    "inputs": [{
        "name": "DS_PROMETHEUS",
        "type": "datasource",
        "pluginId": "prometheus",
        "value": "<YOUR_PROMETHEUS_DATASOURCE_UID>",
    }]
}).encode()

    ### Published dashboard on Grafana.com

    A published version of the GreenKube dashboard is available on Grafana.com's dashboard repository: https://grafana.com/grafana/dashboards/25377-greenkube-fingreenops-dashboard/.

req = urllib.request.Request(
    "http://<GRAFANA_HOST>/api/dashboards/import",
    data=payload,
    headers={
        "Content-Type": "application/json",
        "Authorization": "Basic " + base64.b64encode(b"admin:password").decode(),
    }
)
with urllib.request.urlopen(req) as r:
    print(json.load(r).get("importedUrl"))
Find your Prometheus datasource UID in Grafana → Connections → Data sources → select your Prometheus instance → copy the UID from the URL.
Template variables
| Variable | Type | Query / Options | Description |
|---|---|---|---|
DS_PROMETHEUS |
datasource | prometheus |
Grafana Prometheus datasource |
cluster |
query | label_values(greenkube_cluster_co2e_grams_total, cluster) |
Filter by cluster name |
namespace |
query | label_values(greenkube_namespace_co2e_grams_total{cluster=~"$cluster"}, namespace) |
Filter by namespace (multi-select) |
dashboard_window |
custom | 1h, 6h, 24h, 7d (default), 30d, YTD, 1y |
Reporting window for pre-computed summary panels |
recommendation_metric |
custom | CO₂e (default), Cost |
Ranking basis for actionable recommendations |
recommendation_limit |
custom | 3, 5 (default), 10 |
Number of ranked recommendations displayed |
Dashboard rows
| Row | Key panels | Notes |
|---|---|---|
| GreenKube Impact Command Center | Sustainability Score Radar, Footprint & Cost Mix (Scope 2 / Scope 3 / Cloud cost), GreenKube Impact (CO₂e avoided, cost avoided, implemented), Action Priorities (top-3 namespaces & recommendation types) | Always-visible summary; panels respect $namespace and $dashboard_window filters |
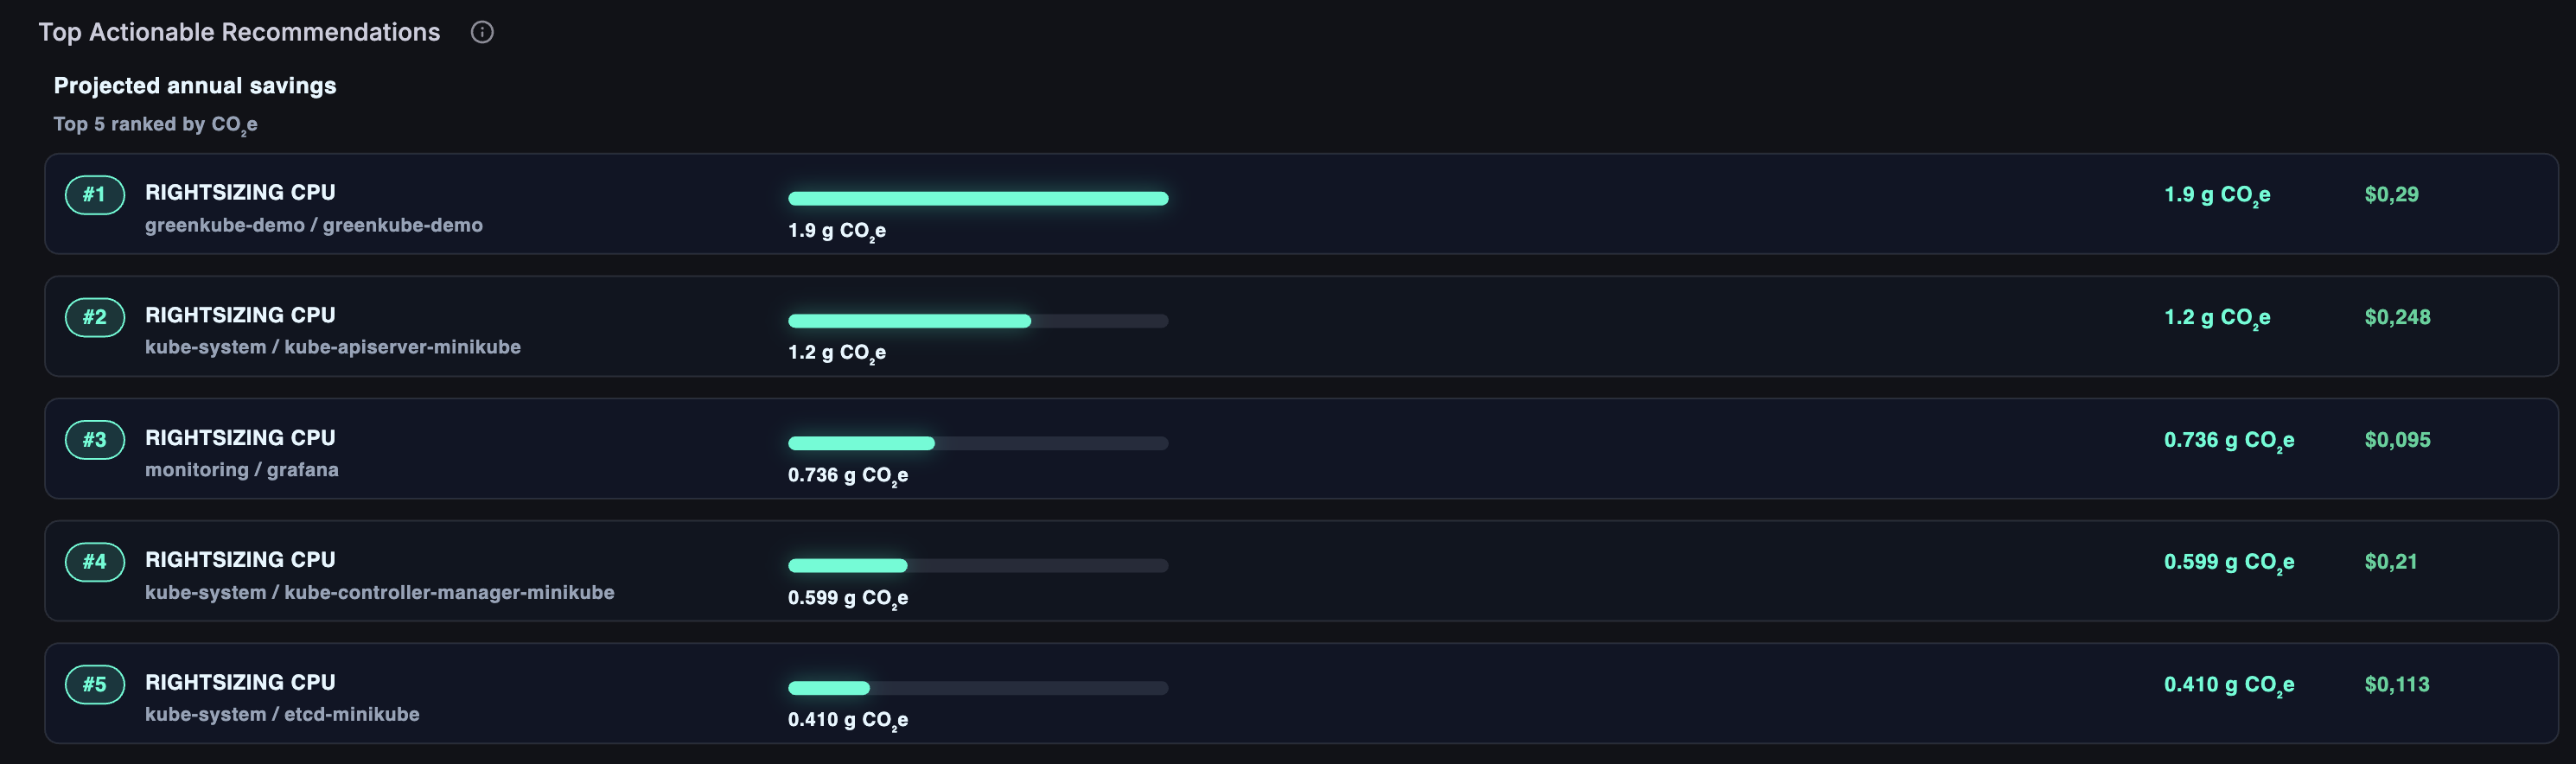
| Actionable Recommendations | Top Actionable Recommendations | Ranked recommendation cards showing recommendation type, namespace, resource, projected annual CO₂e savings, and projected annual cost savings; respects $recommendation_metric, $recommendation_limit, and $namespace |
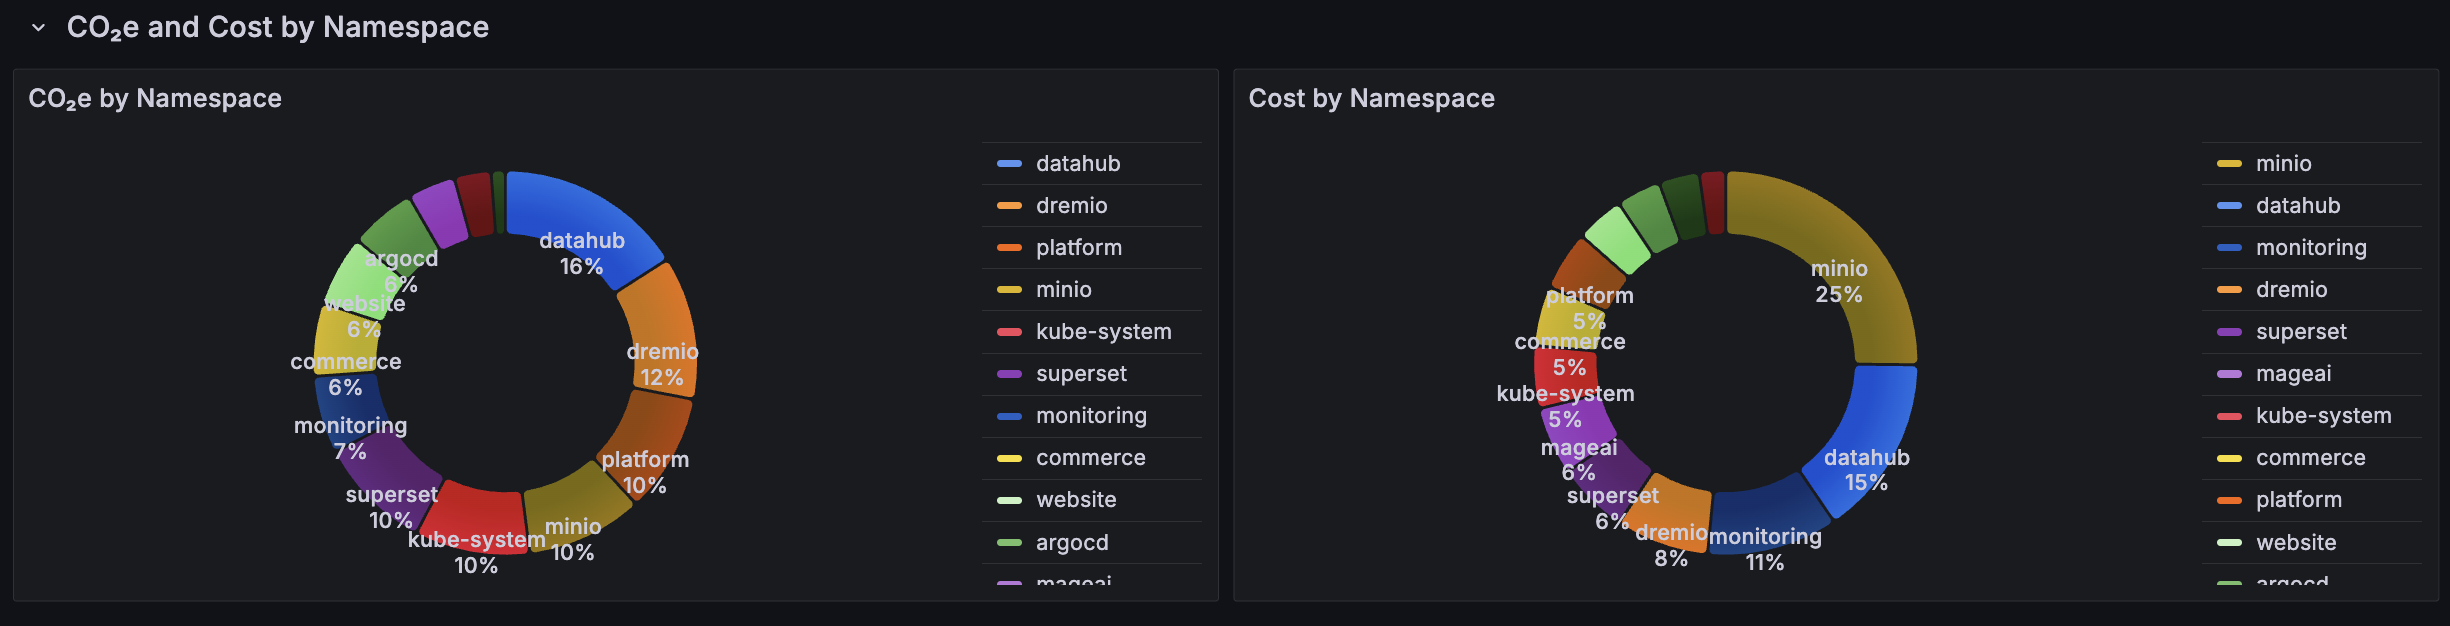
| CO₂e and Cost by Namespace | CO₂e by Namespace, Cost by Namespace | Namespace analysis below actionable recommendations and above the regional map |
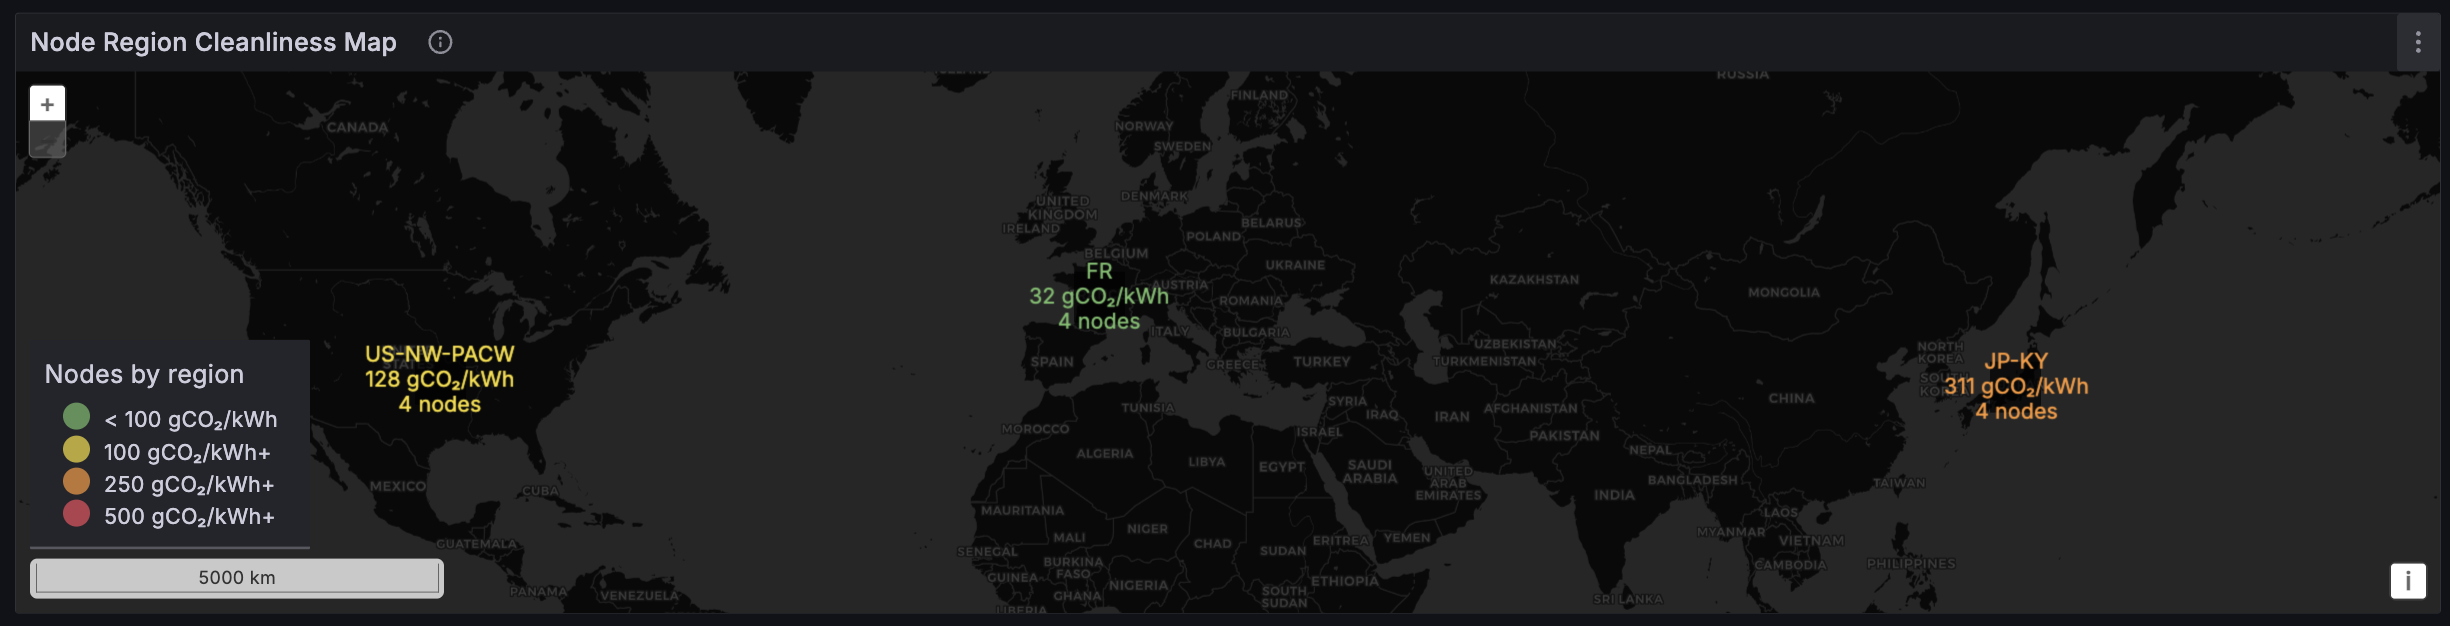
| Regional Node Cleanliness | Node Region Cleanliness Map (Geomap) | Bubble map colored by grid carbon intensity per electricity zone — uses greenkube_zone_grid_intensity_gco2_kwh |
| Top Emitters & Spenders | Top 15 Pods — CO₂e, Top 15 Pods — Cost | Pod-level emitters and spenders only |
Required Grafana plugin: The Command Center row uses Business Charts (volkovlabs-echarts-panel) v7.2.2+. Install it before importing the dashboard, otherwise the radar, footprint, impact, and action-priority panels will not render.
Grafana 12 compatibility
GreenKube’s dashboard targets Grafana 12. Several non-obvious choices were required:
| Issue | Root cause | Solution |
|---|---|---|
instant: true returns empty frames |
Grafana 12 changed how the Prometheus proxy handles instant queries | Range queries are the default; the Action Priorities panel is the only instant-query exception so topk(3) returns a compact sorted set |
| Snapshot panels show “No data” when dashboard time range > available history | Range queries over months return no data when GreenKube has only been running for hours | Use a dashboard time range that overlaps available GreenKube scrape history |
increase() panels must accumulate over the full selected window |
timeFrom: "5m" would collapse the window |
CO₂e Avoided and Cost Avoided panels intentionally have no timeFrom override |
${DS_PROMETHEUS} not resolved |
/api/dashboards/db skips template-variable resolution |
Import via /api/dashboards/import with inputs array |
Rebuilding the dashboard JSON
# Regenerate JSON
python scripts/build_grafana_dashboard.py

# Reimport (replace <UID> and credentials)
python - <<'EOF'
import json, urllib.request, base64
with open("dashboards/greenkube-grafana.json") as f:
    dashboard = json.load(f)
payload = json.dumps({
    "dashboard": dashboard, "folderId": 0, "overwrite": True,
    "inputs": [{"name": "DS_PROMETHEUS", "type": "datasource",
                "pluginId": "prometheus", "value": "<PROMETHEUS_DATASOURCE_UID>"}]
}).encode()
req = urllib.request.Request("http://<GRAFANA_HOST>/api/dashboards/import",
    data=payload,
    headers={"Content-Type": "application/json",
             "Authorization": "Basic " + base64.b64encode(b"admin:password").decode()})
with urllib.request.urlopen(req) as r:
    print(json.load(r).get("importedUrl"))
EOF
5. Troubleshooting
“No data” in all panels
- ServiceMonitor not enabled — in the Prometheus UI (
/targets), verifygreenkube-apiisUP. - Missing
clusterlabel — rungreenkube_sustainability_scorein Prometheus Explore. If the result has noclusterlabel, verify thatK8S_NODE_NAMEis injected via the Downward API in the Helm deployment (helm-chart/templates/deployment.yaml). DS_PROMETHEUSnot resolved — open dashboard settings → Variables.DS_PROMETHEUSmust show your Prometheus datasource name, not the literal string${DS_PROMETHEUS}. Re-import using/api/dashboards/import.- GreenKube just started — metrics are populated after the first scheduler run (≤ 5 minutes). Stat panels show
0until then; they self-correct once the scheduler completes its first cycle.
Datasource shows “not set”
The dashboard was imported via /api/dashboards/db. Re-import using the Python script above.
Recommendations panels show “No data” when a specific namespace is selected
greenkube_recommendations_total now emits one time-series per target namespace plus an
aggregate series with namespace="__all__". Namespace-specific panels filter on
namespace!="__all__", so they will show data only when there are recommendations targeting
that particular namespace. Set the Namespace variable to All to see every recommendation
regardless of its target namespace.