 GreenKube
Measure, understand, and reduce the carbon footprint of your Kubernetes infrastructure. Make your cloud operations both cost-effective and environmentally responsible.
GreenKube is an open-source tool designed to help DevOps, SRE, and FinOps teams get clear carbon visibility and cost control over their Kubernetes infrastructure — without complex setup or expensive SaaS tools.
![]()


🌐 Live demo: demo.greenkube.cloud — explore the dashboard with realistic sample data, no install required.
🎯 Mission
Cloud computing generates significant carbon emissions, yet most engineering teams have no visibility into the footprint of their Kubernetes workloads. GreenKube addresses this by providing tools to:
- Estimate the energy consumption and CO₂e emissions of each Kubernetes workload.
- Visualize these metrics in a real-time dashboard for actionable carbon visibility.
- Optimize infrastructure to simultaneously reduce cloud bills and environmental impact.
✨ Features (Version 0.2.8)
📊 Dashboard & Visualization
- Modern Web Dashboard: Built-in SvelteKit SPA with real-time charts (ECharts), interactive per-pod metrics table, node inventory, and optimization recommendations — all served from the same container as the API.
- REST API: Full-featured FastAPI backend with comprehensive endpoints for metrics, nodes, namespaces, recommendations, timeseries, and configuration. OpenAPI docs included at
/api/v1/docs.
📈 Comprehensive Resource Monitoring
- Multi-Resource Metrics Collection: GreenKube collects the following metrics per pod:
- CPU usage (actual utilization in millicores)
- Memory usage (bytes consumed)
- Network I/O (bytes received/transmitted)
- Disk I/O (bytes read/written)
- Storage (ephemeral storage requests and usage)
- Pod restarts (restart count per container)
- Energy Estimation: Calculates pod-level energy consumption (Joules) based on CPU usage and a built-in library of cloud instance power profiles. Memory, network, disk, and GPU are collected as metrics but are not yet included in the energy model — this is planned for a future release.
- Carbon Footprint Tracking: Converts energy to CO₂e emissions using real-time or default grid carbon intensity data. GPU workloads are currently not supported in the carbon model.
🎯 Optimization & Reporting
- 9-Type Recommendation Engine: Identifies optimization opportunities:
- Zombie pods (idle but costly workloads)
- CPU rightsizing (over-provisioned CPU requests)
- Memory rightsizing (over-provisioned memory requests)
- Autoscaling candidates (high usage variability)
- Off-peak scheduling (idle during off-peak hours)
- Idle namespace cleanup (namespaces with minimal activity)
- Carbon-aware scheduling (shift to lower-carbon zones/times)
- Overprovisioned nodes / Underutilized nodes
- Sustainability Score (0–100): Composite cluster health score computed across 7 weighted dimensions — resource efficiency, carbon efficiency (grid × PUE), waste elimination, node efficiency, scaling practices, carbon-aware scheduling, and stability. 100 = perfect cluster. Exposed as a Prometheus gauge and visualized in the Grafana dashboard.
- Pod & Namespace Reporting: Detailed reports of CO₂e emissions, energy usage, and costs per pod and namespace.
- Historical Analysis: Report on any time period (
--last 7d,--last 3m) with flexible grouping (--daily,--monthly,--yearly). - Data Export: Export reports to CSV or JSON for integration with other tools and BI systems.
🔧 Infrastructure & Deployment
- Demo Mode: Deploy a standalone demo pod with
kubectl runto explore GreenKube with realistic sample data—no live cluster metrics needed. - Grafana Dashboard: Pre-built JSON dashboard with CO₂e, cost, energy, resource, sustainability score, and recommendation panels — import in one click.
- Prometheus Integration: ServiceMonitor and NetworkPolicy for automatic scraping by kube-prometheus-stack.
- Database Migration System: Automated, versioned schema migrations for PostgreSQL and SQLite.
- Flexible Data Backends: Supports PostgreSQL (default/recommended) and SQLite (local/dev) for storing metrics and carbon intensity data.
- Service Auto-Discovery: Automatically discovers in-cluster Prometheus and OpenCost services to simplify setup (manually configurable via Helm values).
- Helm Chart Deployment: Production-ready Helm chart with PostgreSQL StatefulSet, configurable persistence, RBAC, and health probes.
- Security Hardening: All containers run as non-root (UID 10001), with
readOnlyRootFilesystem,allowPrivilegeEscalation: false, dropped capabilities, andseccompProfile: RuntimeDefault. PostgreSQL uses scram-sha-256 authentication. OWASP security headers (CSP, X-Frame-Options, Referrer-Policy) on every API response. Automated Trivy vulnerability scanning in CI. Secrets can be managed externally viasecrets.existingSecretto avoid storing credentials invalues.yaml. - Cloud Provider Support: Built-in profiles for AWS, GCP, Azure, OVH, and Scaleway with automatic region-to-carbon-zone mapping.
- On-Premises Support: Manual zone labeling for bare-metal clusters without cloud provider metadata.
📦 Dependencies
GreenKube collects metrics from services running in your cluster. It auto-discovers them — no manual configuration required in most cases.
| Service | Purpose | Required? |
|---|---|---|
| Prometheus | CPU, memory, network, disk metrics | Recommended — GreenKube works without it but will have no resource metrics |
| OpenCost | Cost allocation data | Optional — cost fields will be empty without it |
Note: GreenKube works with any Prometheus installation — basic
prometheus-community/prometheus,kube-prometheus-stack, or a custom setup. The Prometheus Operator is not required for GreenKube to collect data. However, all CO2 data are based on Prometheus, so the installation is really recommended.If auto-discovery fails, set the service URLs manually in
values.yaml(see theconfig.prometheus.urlandconfig.opencost.urlfields).
🚀 Installation & Usage
The recommended way to install GreenKube is via the official Helm chart.
1. Install
helm repo add greenkube https://GreenKubeCloud.github.io/GreenKube
helm repo update
helm install greenkube greenkube/greenkube \
  -n greenkube \
  --create-namespace
🎮 Get a quick insight with demo mode
Explore GreenKube with realistic sample data in under 30 seconds — no Prometheus or OpenCost required:
With Docker (no Kubernetes needed):
docker run --rm -p 9000:9000 greenkube/greenkube:0.2.8 demo --no-browser --port 9000
# → Open http://localhost:9000
With kubectl:
kubectl run greenkube-demo \
  --image=greenkube/greenkube:0.2.8 \
  --restart=Never \
  --command -- greenkube demo --no-browser --port 9000

kubectl wait --for=condition=Ready pod/greenkube-demo --timeout=60s
kubectl port-forward pod/greenkube-demo 9000:9000
# → Open http://localhost:9000
The demo loads 7 days of metrics for 22 pods across 5 namespaces (production, staging, monitoring, data-pipeline, ci-cd) with carbon emissions, costs, and optimization recommendations pre-populated.
kubectl delete pod greenkube-demo # clean up when done (kubectl only)
This deploys GreenKube with the collector, API server, web dashboard, and PostgreSQL — all in a single command.
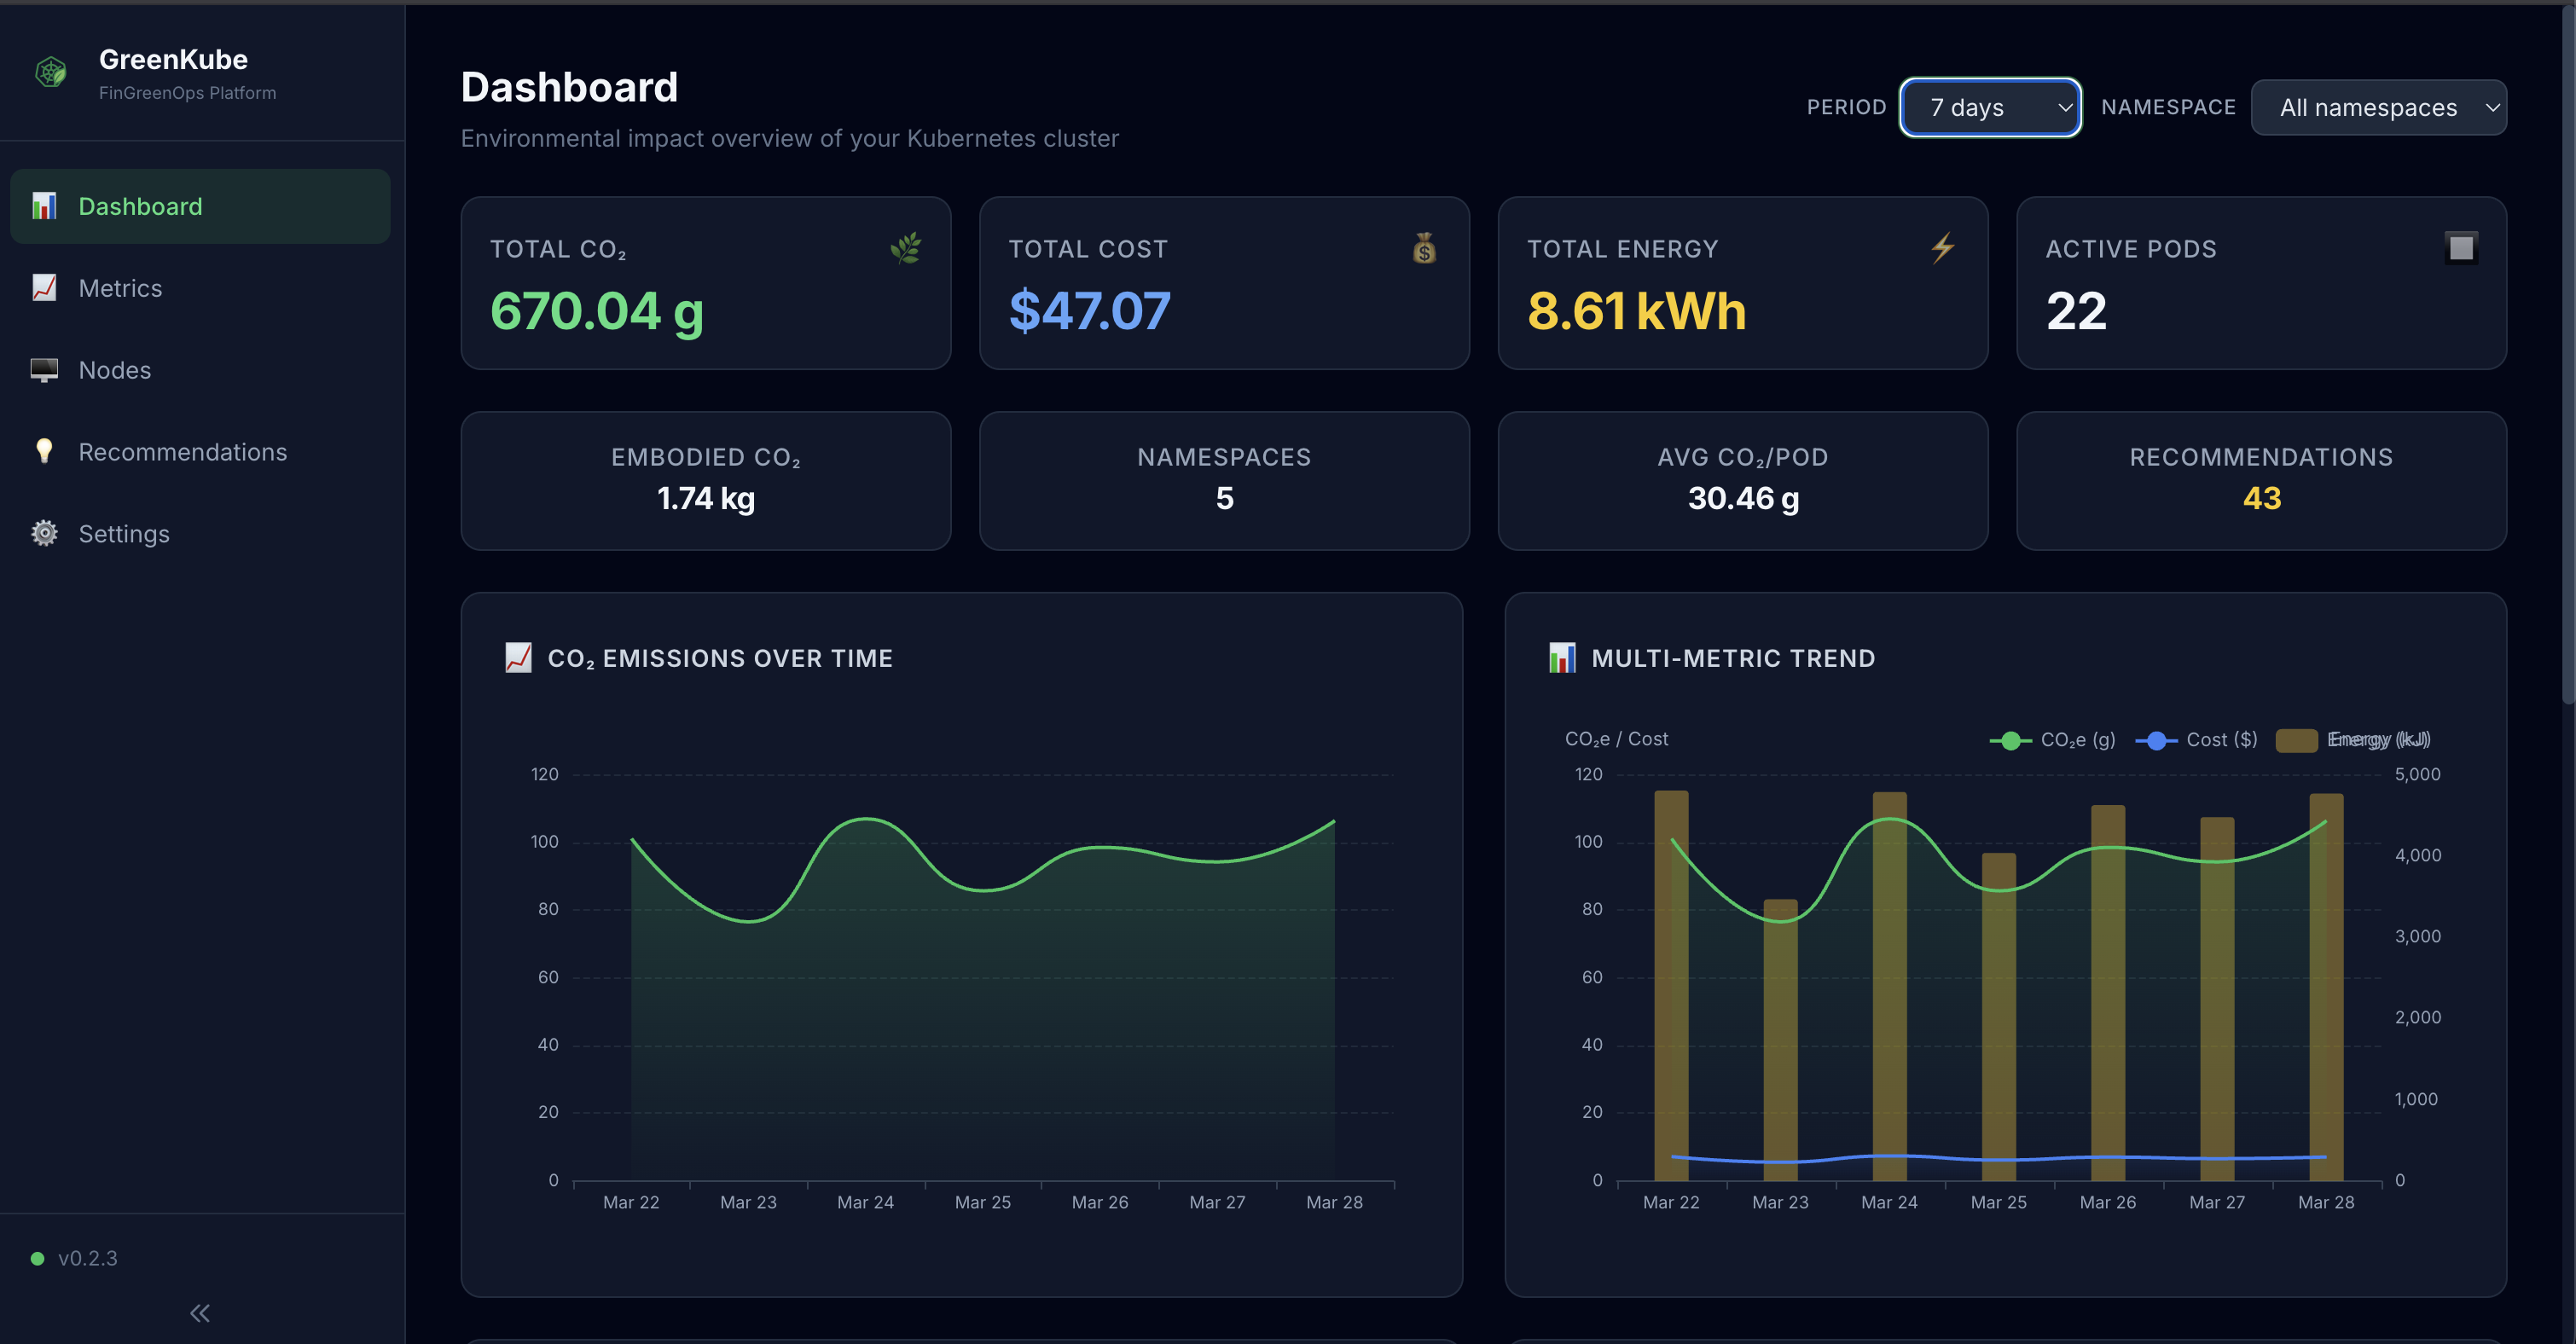
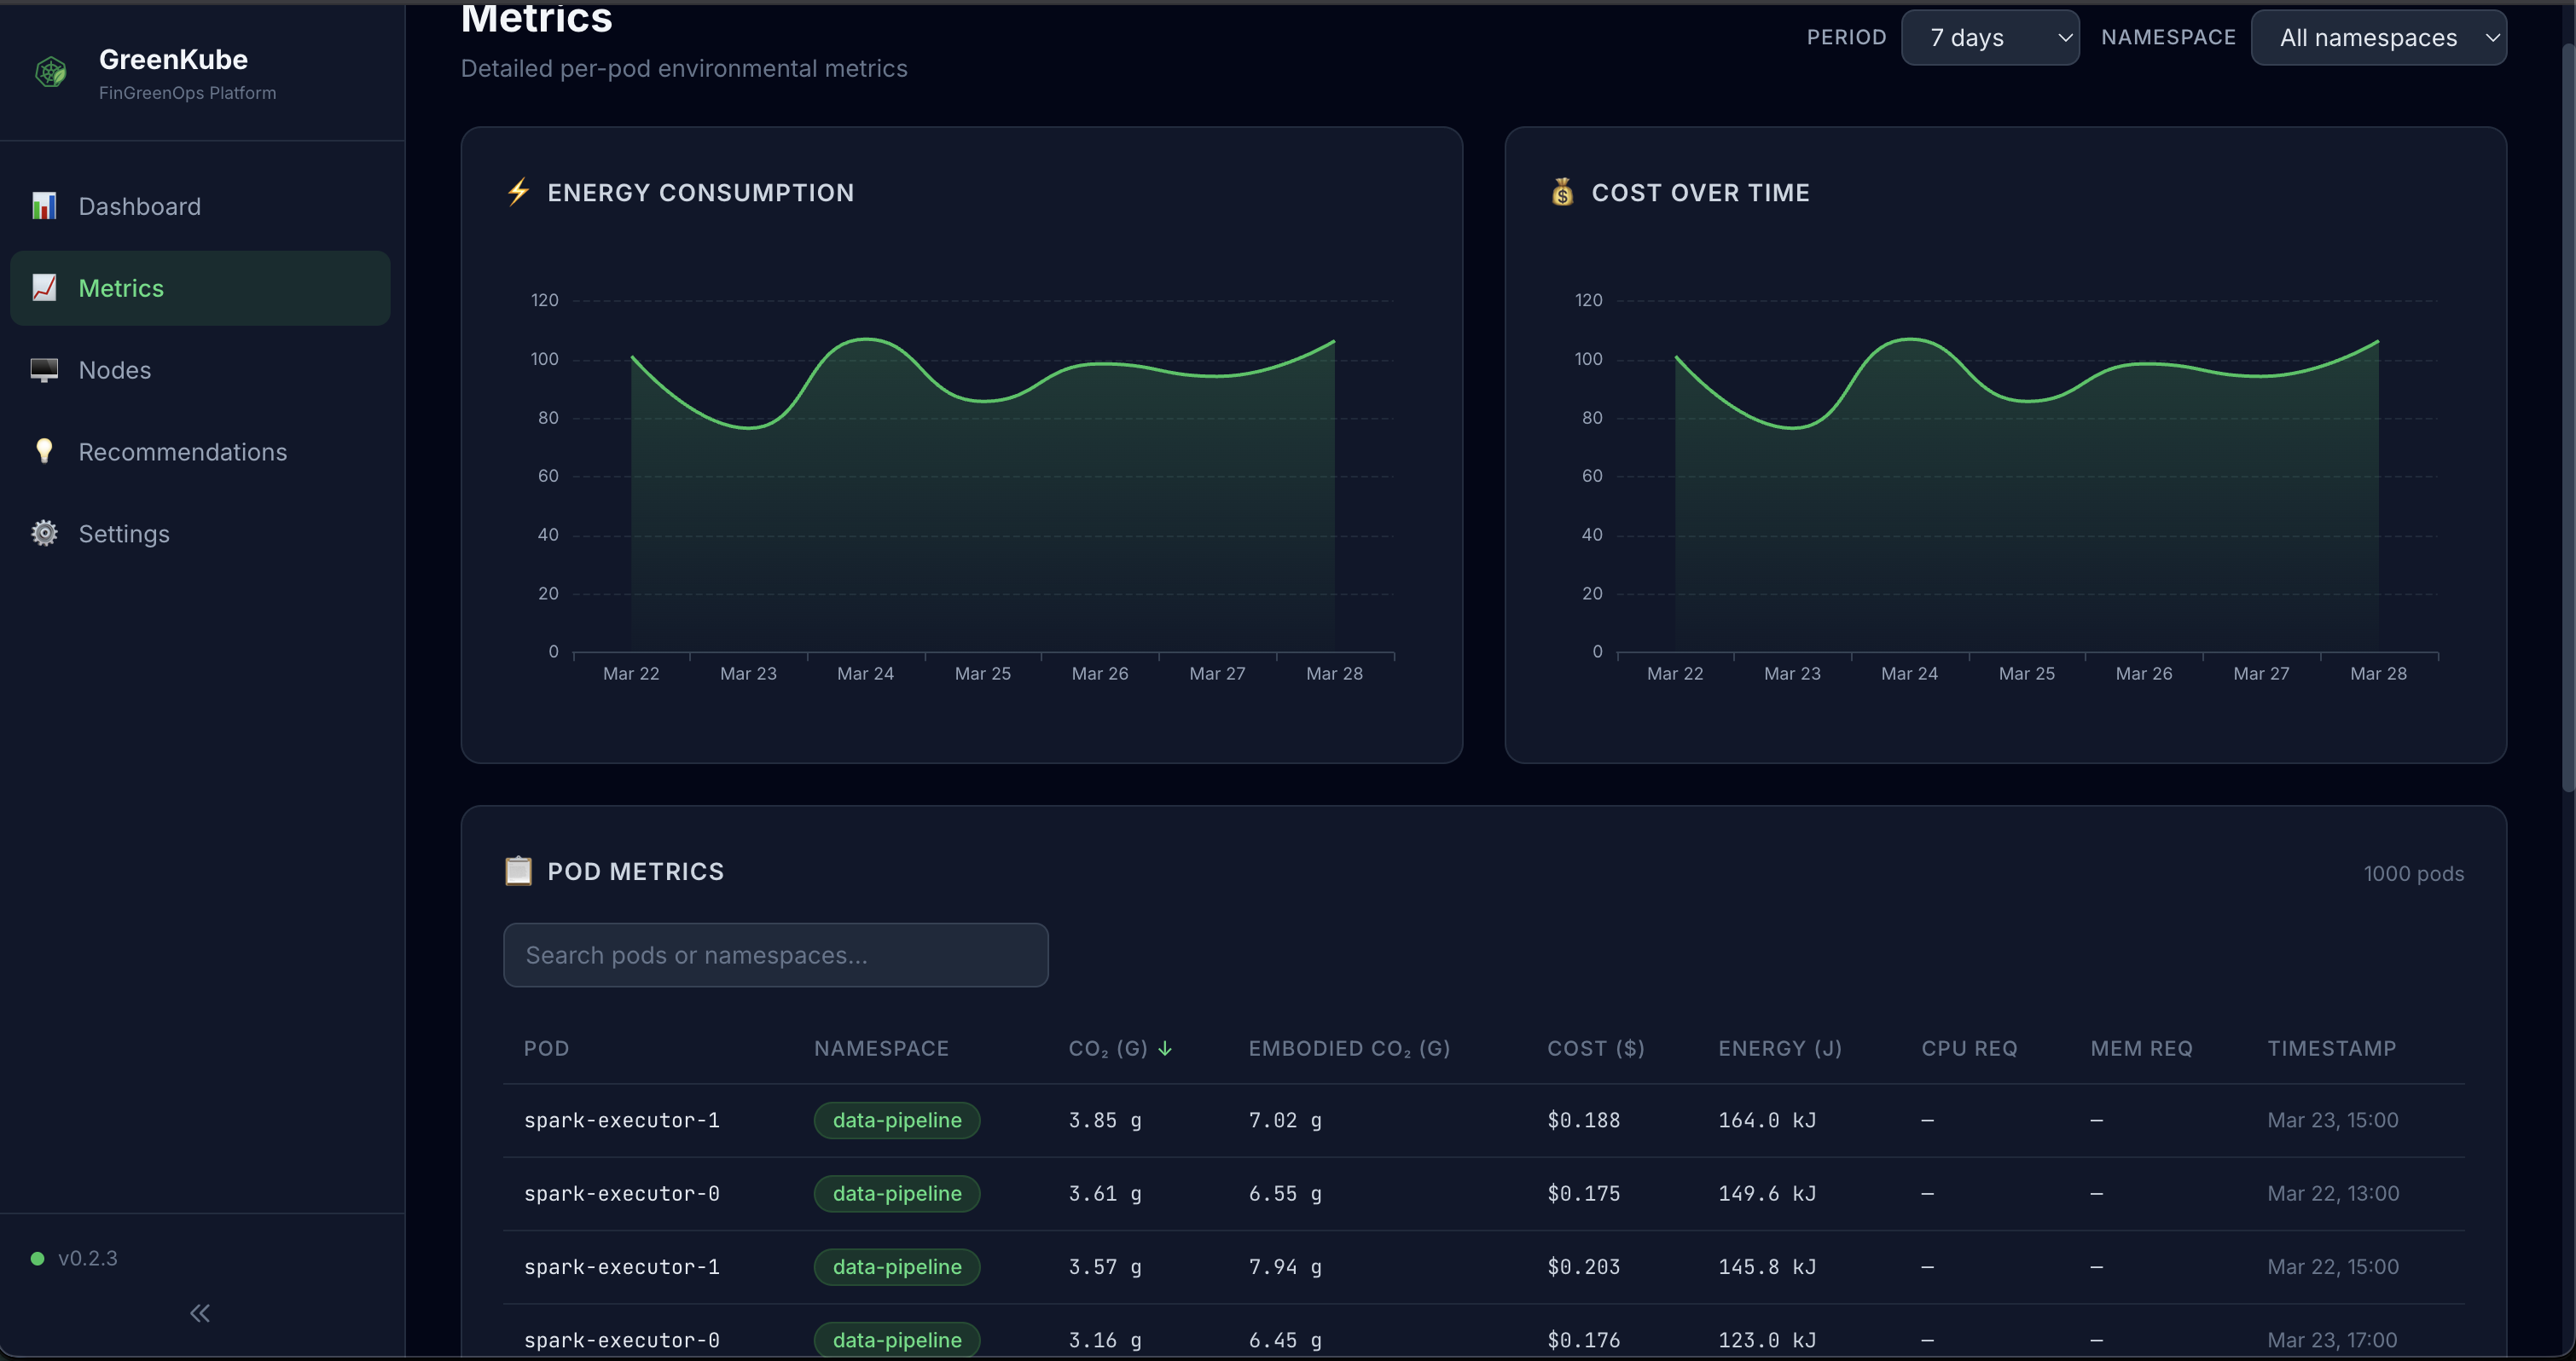
📸 Screenshots
| Dashboard | Metrics |
|---|---|
 |
 |
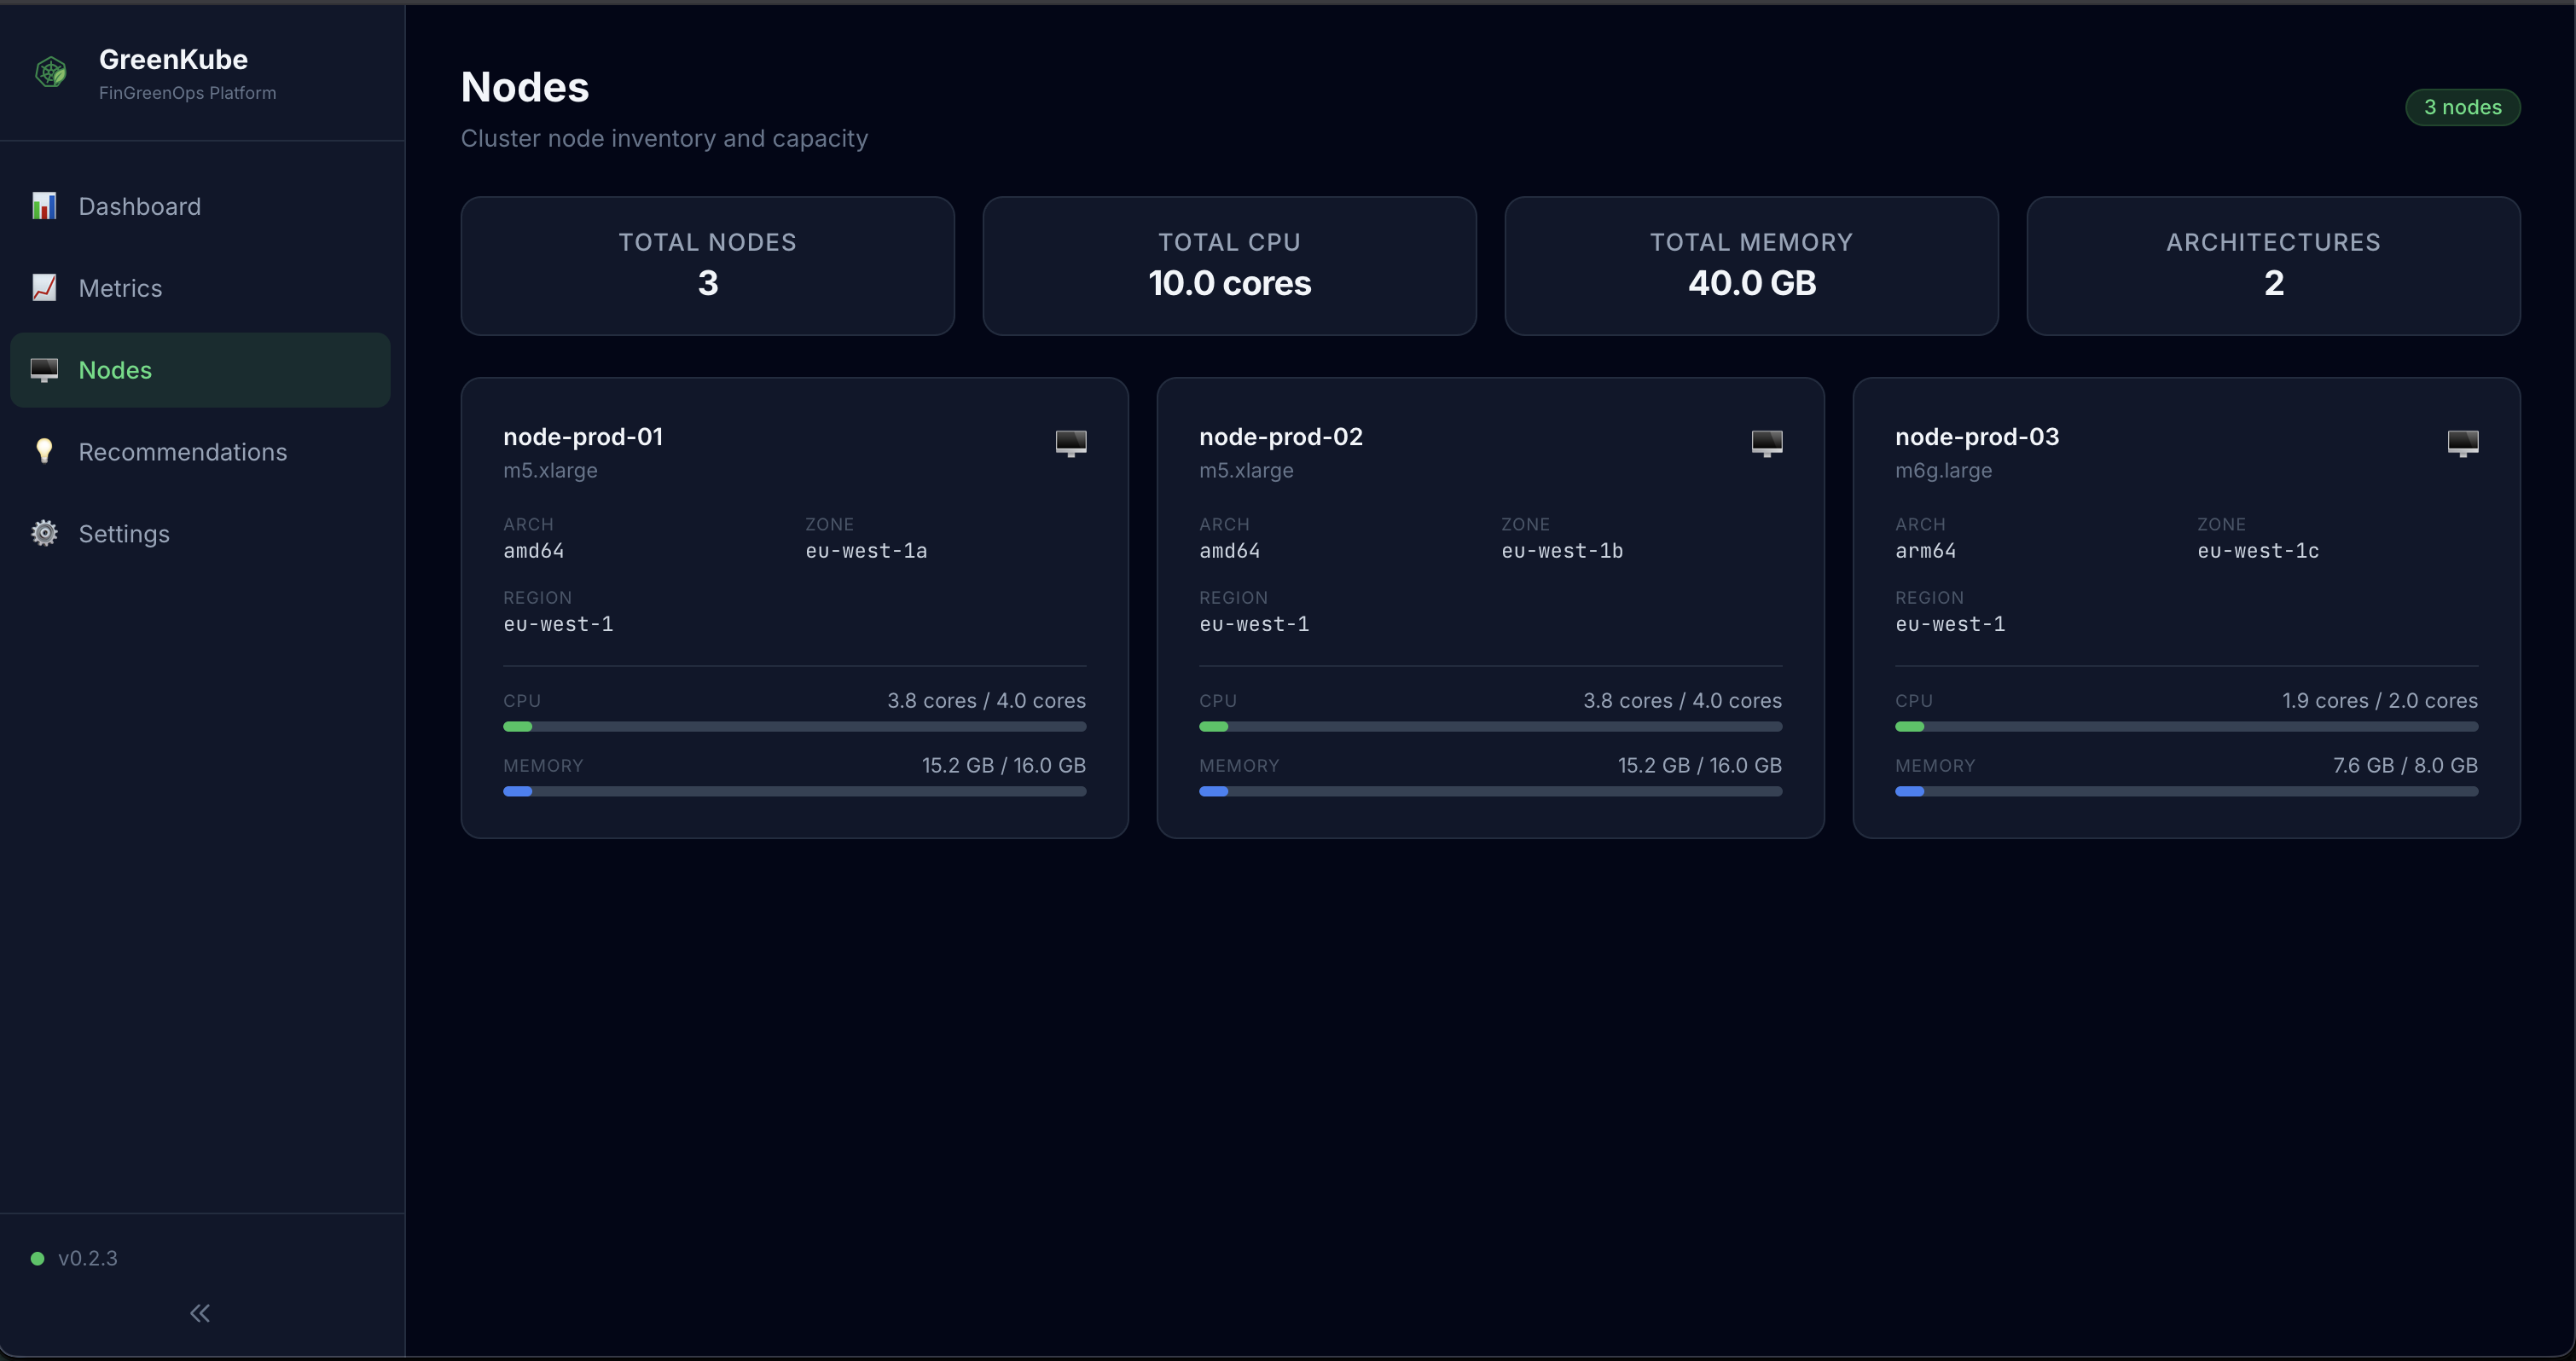
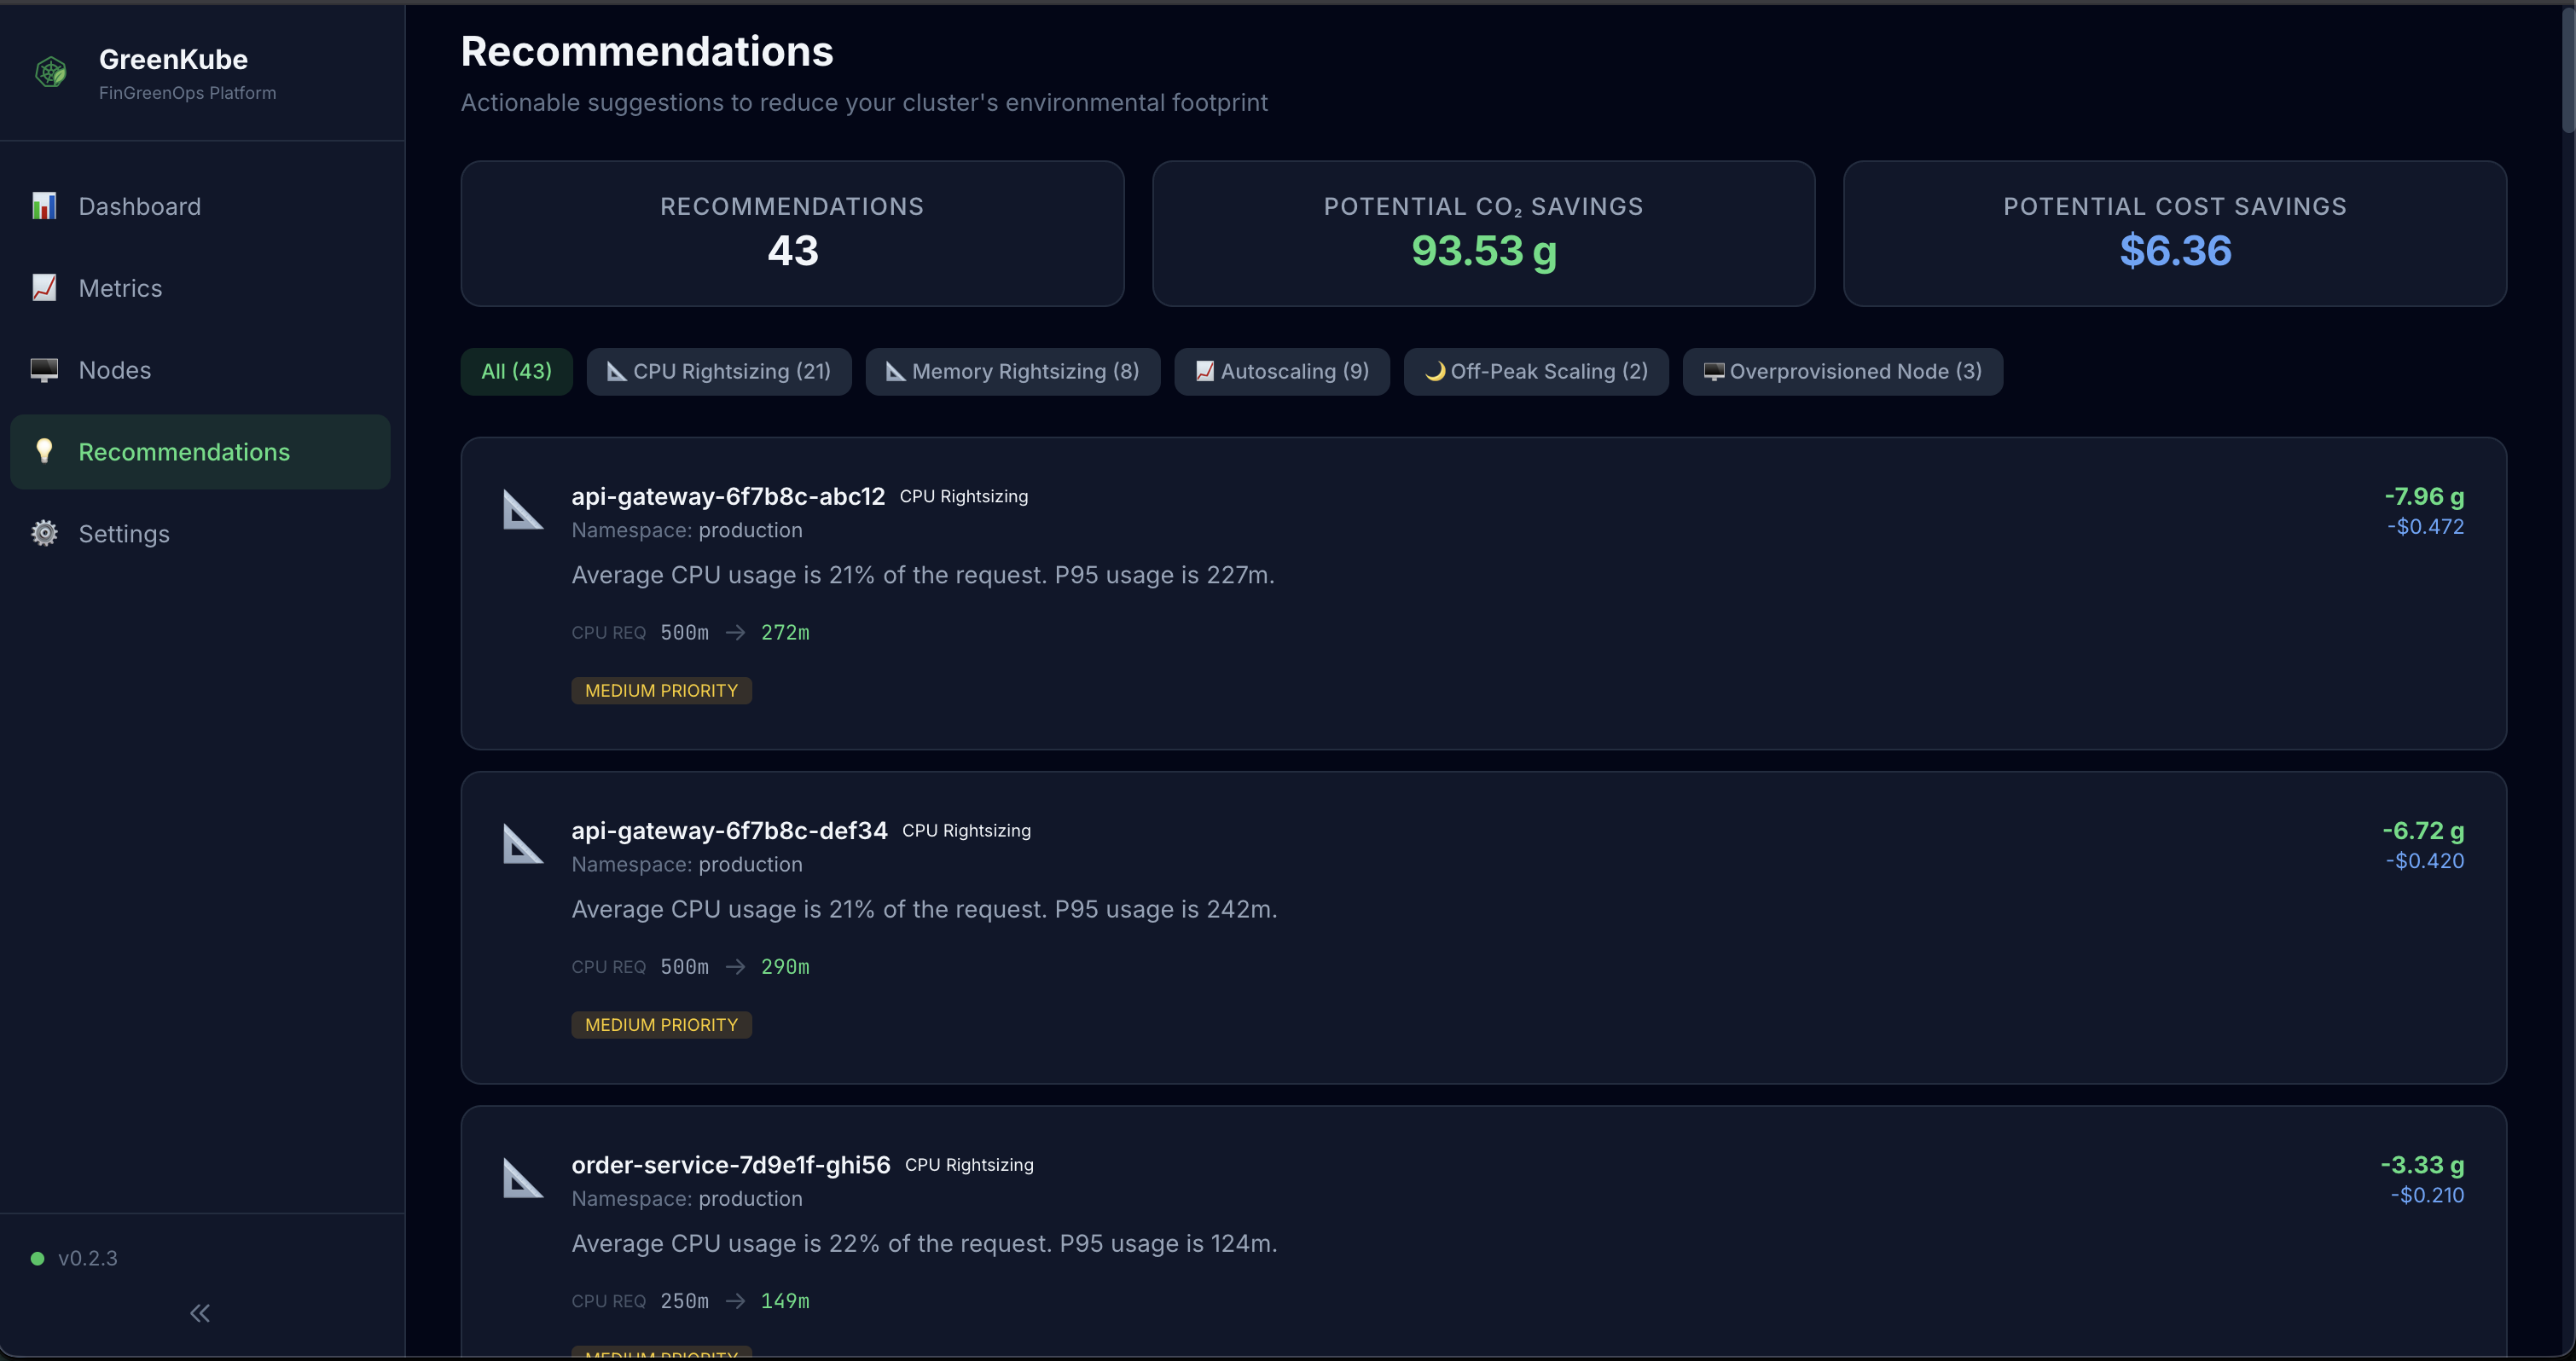
| Nodes | Recommendations |
|---|---|
 |
 |
| Report | Settings |
|---|---|
 |
 |
2. Access the Dashboard
kubectl port-forward svc/greenkube-api 8000:8000 -n greenkube
# → Open http://localhost:8000
3. (Optional) Add Secrets & Custom Configuration
GreenKube works out of the box, but you have to customize your deployment to have as accurate data as possible. To do so, create a my-values.yaml:
secrets:
  # (Optional) Electricity Maps API token — for real-time grid carbon intensity.
  # Get a free token at https://www.electricitymaps.com/
  # Without a token, GreenKube uses a default of 500 gCO₂e/kWh.
  electricityMapsToken: "YOUR_TOKEN_HERE"

# Uncomment to manually set your Prometheus URL
# (If left empty, GreenKube will try to auto-discover it)
# config:
#   prometheus:
#     url: "http://prometheus-k8s.monitoring.svc.cluster.local:9090"
Then apply it:
helm upgrade greenkube greenkube/greenkube \
  -f my-values.yaml \
  -n greenkube
On-Premises / Bare-Metal Clusters
Cloud providers automatically expose zone labels on nodes (e.g., topology.kubernetes.io/zone). On-premises clusters do not have these labels, so GreenKube cannot determine the electrical grid zone. You must configure the zone manually:
# 1. Label your nodes with their geographic zone (ISO 3166 country code)
#    This tells GreenKube which electrical grid to use for carbon intensity.
#    Common zones: FR (France), DE (Germany), US-CAL-CISO (California), GB (UK)
#    Full list: https://app.electricitymaps.com/map
kubectl label nodes --all topology.kubernetes.io/zone=FR

# 2. Set the cloud provider to "on-prem" and the default zone in your values
cat <<EOF >> my-values.yaml
config:
  cloudProvider: on-prem
  defaultZone: FR
EOF
Tip: If your cluster spans multiple locations, label each node individually with the correct zone (e.g.,
FRfor Paris,DEfor Frankfurt).
🖥️ Web Dashboard
GreenKube ships with a built-in web dashboard (SvelteKit SPA served by the API). Once deployed, access it via port-forward:
kubectl port-forward svc/greenkube-api 8000:8000 -n greenkube
Then open http://localhost:8000 in your browser.
The dashboard includes:
- Dashboard — KPI cards (CO₂, cost, energy, pods), time-series charts (ECharts), namespace breakdown pie chart, and top pods by emissions/cost
- Metrics — Interactive table with sortable and searchable per-pod metrics including energy, cost, and all resource consumption data (CPU, memory, network, disk, storage)
- Nodes — Cluster node inventory with CPU/memory capacity bars, hardware profiles, cloud provider info, and carbon zones
- Recommendations — Actionable optimization suggestions (zombie pods, rightsizing opportunities) with estimated savings in cost and CO₂e
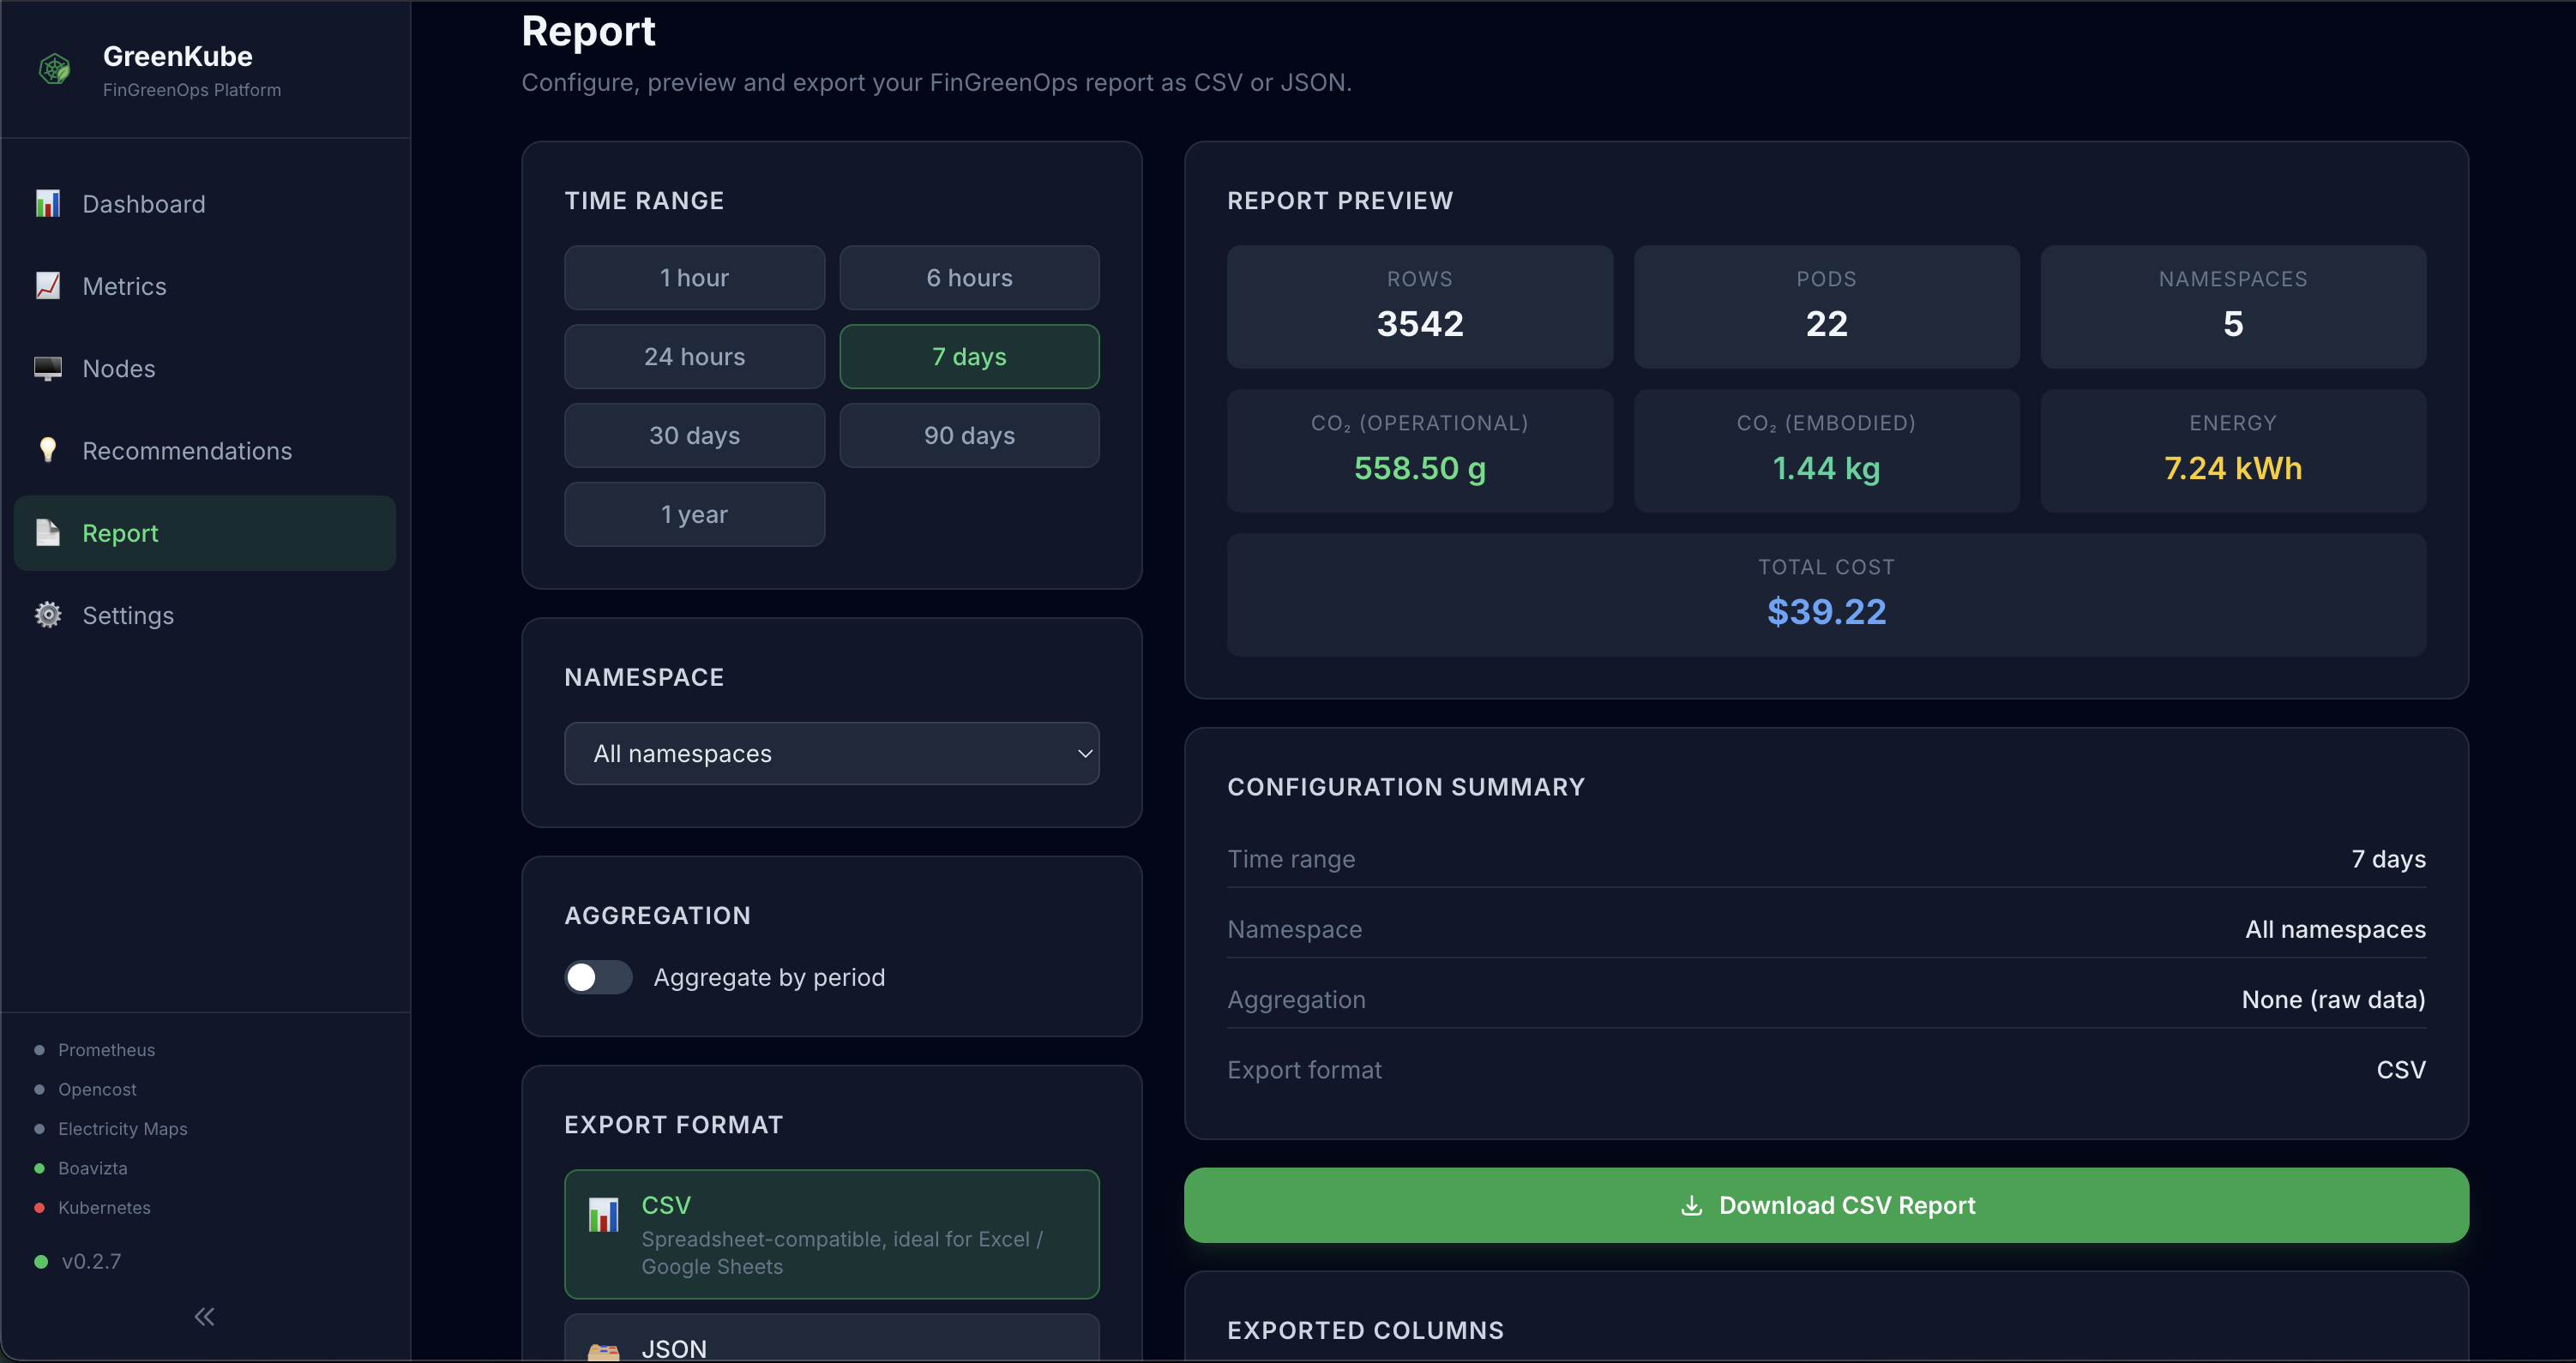
- Report — Configure, preview and export a FinGreenOps report: choose time range, namespace, aggregation (hourly/daily/weekly/monthly/yearly) and download as CSV or JSON directly from the browser — no CLI access required
- Settings — Current configuration, API health status, version info, and database connection details
🎨 Dashboard Features
- Auto-refresh with configurable polling interval
- Responsive design works on desktop and mobile
- Dark/light theme support
- Export capabilities for charts and data tables
- Advanced filtering by namespace, time range, and resource type
Prometheus & Grafana Integration
GreenKube has two distinct Prometheus integrations:
- GreenKube → Prometheus (automatic): GreenKube queries your Prometheus for CPU, memory, network, and disk metrics. This works out of the box with any Prometheus installation — no configuration needed.
- Prometheus → GreenKube (optional): Prometheus scrapes GreenKube’s own
/prometheus/metricsendpoint to expose GreenKube-computed metrics (CO₂e, cost, energy) in Grafana. This requires either aServiceMonitor(Prometheus Operator) or a manualscrape_config.
Exposing GreenKube Metrics to Prometheus (for Grafana)
If you use the kube-prometheus-stack (Prometheus Operator), enable the ServiceMonitor to let Prometheus scrape GreenKube metrics:
Note: The ServiceMonitor requires the Prometheus Operator CRDs (
monitoring.coreos.com/v1). It is disabled by default to allow installation on clusters without Prometheus Operator.
# In your my-values.yaml
monitoring:
  serviceMonitor:
    enabled: true            # Creates a ServiceMonitor resource (requires Prometheus Operator)
    namespace: monitoring    # Must match your Prometheus serviceMonitorNamespaceSelector
    interval: 30s
  networkPolicy:
    enabled: true            # Allows Prometheus to reach the GreenKube API port
    prometheusNamespace: monitoring
Or via --set flags:
helm install greenkube greenkube/greenkube \
  -n greenkube --create-namespace \
  --set monitoring.serviceMonitor.enabled=true \
  --set monitoring.networkPolicy.enabled=true
GreenKube metrics include:
greenkube_pod_co2e_grams— CO₂e emissions per pod (cluster,namespace,pod,node,region)greenkube_pod_energy_joules— Energy consumption per podgreenkube_pod_cost_dollars— Cost per podgreenkube_pod_cpu_usage_millicores,greenkube_pod_memory_usage_bytes— Resource usagegreenkube_pod_network_receive_bytes,greenkube_pod_network_transmit_bytes— Network I/Ogreenkube_sustainability_score— Composite sustainability score (0–100, higher is better) perclustergreenkube_sustainability_dimension_score— Per-dimension score (0–100) withclusteranddimensionlabelsgreenkube_carbon_intensity_score— Energy-weighted average grid carbon intensity (gCO₂e/kWh)greenkube_carbon_intensity_zone— Real-time grid carbon intensity perzonegreenkube_recommendation_total— Recommendation counts by typegreenkube_node_info— Node metadata (instance type, zone, capacity)
Manual Prometheus config (if not using the Operator):
# Add to your prometheus.yml
scrape_configs:
  - job_name: 'greenkube'
    scrape_interval: 30s
    metrics_path: /prometheus/metrics
    static_configs:
      - targets: ['greenkube-api.greenkube.svc.cluster.local:8000']
Grafana Dashboard
Import the pre-built dashboard from dashboards/greenkube-grafana.json:
- In Grafana, go to Dashboards → Import
- Upload
dashboards/greenkube-grafana.json(or paste the JSON) - Select your Prometheus data source
- Click Import
The dashboard includes:
- KPI row: Total CO₂e, total cost, total energy, active pods, active nodes
- Time-series: CO₂e over time, cost over time, energy over time
- Namespace breakdown: Pie charts for CO₂e and cost by namespace
- Top pods: Bar charts for heaviest emitters and most expensive pods
- Node utilization: CPU and memory usage per node
- Grid intensity: Carbon intensity over time per zone
- Sustainability golden signal: Composite 0–100 score gauge, per-dimension bar chart, and score timeline — filterable by
clusterandregiontemplate variables - Recommendations: Summary table of optimization suggestions
🔌 API Reference
The API is available at /api/v1 and serves both JSON endpoints and the web dashboard.
| Endpoint | Description |
|---|---|
GET /api/v1/health |
Health check and version |
GET /api/v1/version |
Application version |
GET /api/v1/config |
Current configuration |
GET /api/v1/metrics?namespace=&last=24h |
Per-pod metrics |
GET /api/v1/metrics/summary?namespace=&last=24h |
Aggregated summary |
GET /api/v1/metrics/timeseries?granularity=day&last=7d |
Time-series data |
GET /api/v1/namespaces |
List of active namespaces |
GET /api/v1/nodes |
Cluster node inventory |
GET /api/v1/recommendations?namespace= |
Optimization recommendations |
GET /api/v1/report/summary?namespace=&last=24h&aggregate=true&granularity=daily |
Report preview (row count + totals) |
GET /api/v1/report/export?format=csv&last=7d&aggregate=true&granularity=daily |
Download report as CSV or JSON |
Interactive API docs are available at /api/v1/docs (Swagger UI).
API Examples
# Get a health check
curl http://localhost:8000/api/v1/health
# {"status":"ok","version":"0.2.8"}

# Get metrics for the last 24 hours
curl "http://localhost:8000/api/v1/metrics?last=24h"

# Get metrics summary for a specific namespace
curl "http://localhost:8000/api/v1/metrics/summary?namespace=default&last=7d"
# {"total_co2e_grams":142.5,"total_embodied_co2e_grams":12.3,"total_cost":0.87,...}

# Get hourly timeseries data for the last 7 days
curl "http://localhost:8000/api/v1/metrics/timeseries?granularity=hour&last=7d"

# Get optimization recommendations
curl "http://localhost:8000/api/v1/recommendations?namespace=production"

# Preview a report (row count + totals) before downloading
curl "http://localhost:8000/api/v1/report/summary?last=30d&aggregate=true&granularity=daily"
# {"total_rows":450,"total_co2e_grams":8234.5,"total_cost":12.34,...}

# Download a CSV report for the last 7 days, aggregated daily
curl -O -J "http://localhost:8000/api/v1/report/export?format=csv&last=7d&aggregate=true&granularity=daily"

# Download a raw JSON report for a specific namespace
curl -O -J "http://localhost:8000/api/v1/report/export?format=json&last=30d&namespace=production"
📈 Running Reports & Getting Recommendations
The primary way to interact with GreenKube is by using kubectl exec to run commands inside the running pod.
1. Find your GreenKube pod:
kubectl get pods -n greenkube
(Look for a pod named something like greenkube-7b5…)
2. Run an on-demand report:
# Replace <pod-name> with the name from the previous step
kubectl exec -it <pod-name> -n greenkube -- bash
3. Run a report:
greenkube report --daily
See the doc or greenkube report --help to see more options.
4. Get optimization recommendations:
greenkube recommend
🏗️ Architecture Summary
GreenKube follows a clean, hexagonal architecture with strict separation between core business logic and infrastructure adapters.
Core Components
Collectors (Input Adapters):
- PrometheusCollector: Fetches CPU, memory, network I/O, disk I/O, and restart count metrics via PromQL queries
- NodeCollector: Gathers node metadata (zones, instance types, capacity) from Kubernetes API
- PodCollector: Collects resource requests (CPU, memory, ephemeral storage) from pod specs
- OpenCostCollector: Retrieves cost allocation data for financial reporting
- ElectricityMapsCollector: Fetches real-time carbon intensity data by geographic zone
- BoaviztaCollector: Fetches hardware embodied emissions from Boavizta API
Processing Pipeline (DataProcessor delegates to focused collaborators):
- CollectionOrchestrator: Runs all collectors in parallel via
asyncio.gather - BasicEstimator: Converts CPU usage into energy consumption (Joules) using cloud instance power profiles
- NodeZoneMapper: Maps cloud provider zones to Electricity Maps carbon zones
- PrometheusResourceMapper: Builds per-pod resource maps (CPU, memory, network, disk, restarts) from Prometheus data
- CostNormalizer: Divides OpenCost daily/range totals into per-step values
- MetricAssembler: Combines energy, cost, resources, and metadata into unified
CombinedMetricobjects - HistoricalRangeProcessor: Processes time ranges in day-sized chunks for memory efficiency
- EmbodiedEmissionsService: Fetches, caches, and calculates Boavizta embodied emissions per pod
- CarbonCalculator: Converts energy (Joules → kWh) to CO₂e using grid intensity and PUE
Business Logic:
- Recommender: Analyzes CombinedMetric data with 9 analyzer types:
- Zombie detection, CPU/memory rightsizing, autoscaling candidates
- Off-peak scheduling, idle namespace cleanup, carbon-aware scheduling
- Overprovisioned/underutilized node detection
- SustainabilityScorer: Computes the composite 0–100 sustainability score across 7 dimensions; PUE-aware carbon efficiency uses
grid_intensity × PUEas the effective carbon cost
Storage (Output Adapters):
- Repositories: Abstract interfaces implemented for multiple backends:
- PostgresRepository: Production-grade persistent storage (asyncpg driver)
- SQLiteRepository: Local development and testing (aiosqlite driver)
- NodeRepository: Historical node state snapshots for accurate time-range reporting
- EmbodiedRepository: Boavizta API integration for hardware embodied emissions
API & Presentation:
- FastAPI Server: REST API with OpenAPI documentation, CORS support, health checks, Prometheus metrics endpoint
- SvelteKit Dashboard: Modern SPA with ECharts visualizations and Tailwind CSS
- Grafana Dashboard: Pre-built FinGreenOps dashboard via Prometheus integration
Data Flow
- Collection Phase (async/concurrent):
Prometheus → CPU, memory, network, disk metrics Kubernetes → Node metadata, pod resource requests OpenCost → Cost allocation data - Processing Phase:
Raw metrics → Energy estimation (Joules per pod) Node metadata → Cloud zone mapping Historical data → Node state reconstruction - Calculation Phase:
Energy + Grid intensity + PUE → CO₂e emissions Metrics + Cost data → Combined metrics - Analysis Phase:
Combined metrics → Recommendations engine Time-series data → Trend analysis - Storage & Presentation:
Combined metrics → Database (Postgres/SQLite/ES)
Database → API → Web Dashboard
API → CLI reports/exports
Key Design Principles
- Async-First: Fully leverages Python
asynciofor non-blocking I/O operations - Database Agnostic: Repository pattern abstracts storage implementation
- Cloud Agnostic: Supports AWS, GCP, Azure, OVH, Scaleway with extensible mapping
- Resilient: Graceful degradation when data sources are unavailable
- Transparent: Clear flagging of estimated vs. measured values with reasoning
- Modular: Each component is independently testable and replaceable
- Observable: Comprehensive logging at all pipeline stages
🔬 How Energy & CO₂e Estimation Works
GreenKube’s estimation pipeline converts raw Kubernetes metrics into actionable carbon data in four steps:
- Collect CPU usage — Prometheus provides per-pod CPU utilisation in millicores over each collection interval.
- Map to power — Each node’s instance type is matched to a power profile (min/max watts per vCPU) derived from SPECpower benchmarks and the Cloud Carbon Footprint coefficient database. The power draw is linearly interpolated between min watts (idle) and max watts (100 % utilisation).
- Apply PUE — The estimated power is multiplied by the Power Usage Effectiveness factor for the cloud provider’s data centre (e.g. 1.135 for AWS, 1.10 for GCP).
- Convert to CO₂e — Energy (kWh) is multiplied by the grid carbon intensity of the node’s geographic zone. When available, real-time intensity is fetched from the Electricity Maps API; otherwise a configurable default is used.
Embodied emissions are estimated separately via the Boavizta API, which models the manufacturing footprint of cloud instances amortised over their expected lifespan.
For provider-specific coefficients and the full derivation, see docs/power_estimation_methodology.md.
📋 Changelog
See CHANGELOG.md for a full version history and the GitHub Releases page for published releases.
🤝 Contributing
GreenKube is a community-driven project, and we welcome all contributions! Check out our CONTRIBUTING.md file to learn how to get involved.
Development Setup
# Clone and install
git clone https://github.com/GreenKubeCloud/GreenKube.git
cd GreenKube
python -m venv .venv
source .venv/bin/activate
pip install -e ".[dev,test]"
pre-commit install

# Run the tests
pytest

# Run the frontend tests
cd frontend && npm install && npm test

# Start the API locally (uses SQLite by default)
DB_TYPE=sqlite greenkube-api

# Run the frontend
cd frontend && npm install && npm run dev
-
Report Bugs: Open an Issue with a detailed description.
-
Suggest Features: Let’s discuss them in the GitHub Discussions.
-
Submit Code: Make a Pull Request!
📄 Licence
This project is licensed under the Apache 2.0 License. See the LICENSE file for more details.